. 2014 Feb;35(2):125-31.
doi: 10.1016/j.placenta.2013.11.007. Epub 2013 Dec 1.

A comprehensive analysis of the human placenta transcriptome

Affiliations

A comprehensive analysis of the human placenta transcriptome

J Saben et al. Placenta. 2014 Feb.

Abstract

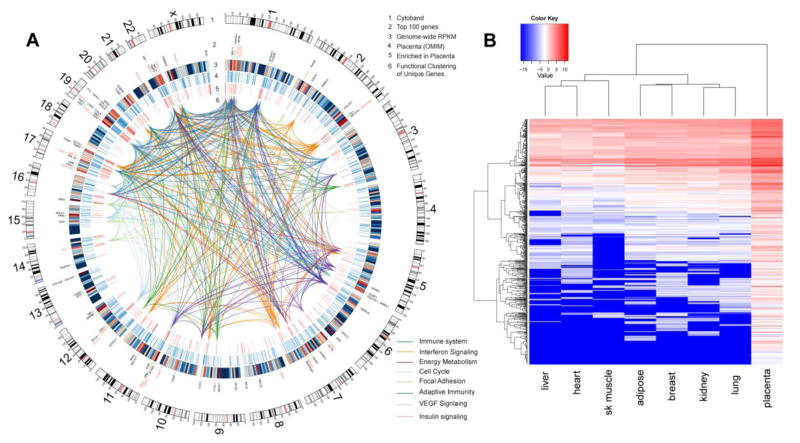
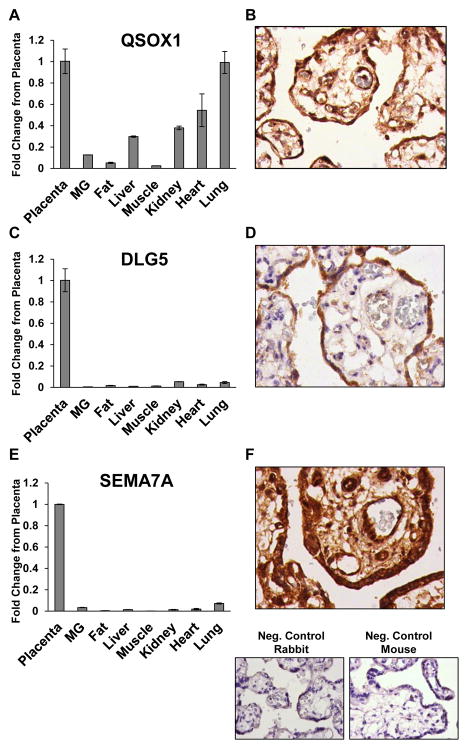
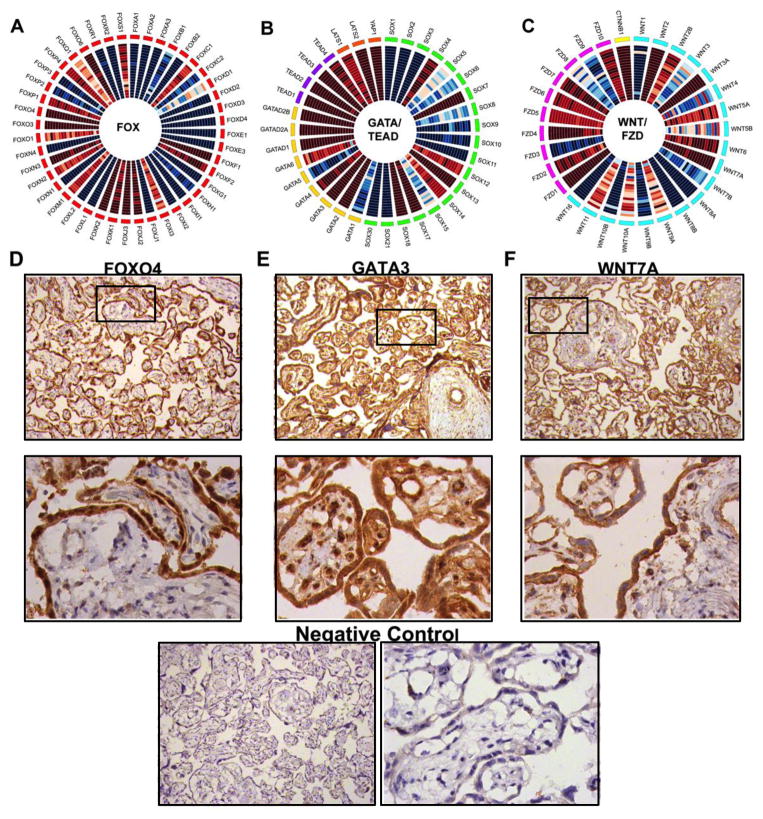
As the conduit for nutrients and growth signals, the placenta is critical to establishing an environment sufficient for fetal growth and development. To better understand the mechanisms regulating placental development and gene expression, we characterized the transcriptome of term placenta from 20 healthy women with uncomplicated pregnancies using RNA-seq. To identify genes that were highly expressed and unique to the placenta we compared placental RNA-seq data to data from 7 other tissues (adipose, breast, hear, kidney, liver, lung, and smooth muscle) and identified several genes novel to placental biology (QSOX1, DLG5, and SEMA7A). Semi-quantitative RT-PCR confirmed the RNA-seq results and immunohistochemistry indicated these proteins were highly expressed in the placental syncytium. Additionally, we mined our RNA-seq data to map the relative expression of key developmental gene families (Fox, Sox, Gata, Tead, and Wnt) within the placenta. We identified FOXO4, GATA3, and WNT7A to be amongst the highest expressed members of these families. Overall, these findings provide a new reference for understanding of placental transcriptome and can aid in the identification of novel pathways regulating placenta physiology that may be dysregulated in placental disease.

Keywords: Development; Fetal tissue; Gene expression; Pregnancy; RNA-seq.


Figures

Figure 1
Figure 1. RNA-seq of human term placenta (n=20)
A) Circos diagram depicting whole-genome RNA-seq data. Track 1: cytoband, chromosomes are depicted qter to pter. Track 2: Genomic location of top 100 highly expressed genes in placenta based on average RPKM values. Gene names in red represent genes specifically enriched in placenta. Track 3: Average RPKM values summarized over 6 MB regions showing regions of high gene expression. Track 4: Locations of genes related to placenta in the OMIM database. Track 5: Genes specifically enriched in placenta (3-fold over 7 other tissues); Track 6: Biological functions enriched among placenta-enriched genes. High-resolution images are provided in supplementary material. B) Hierarchical clustering of the 288 genes that were at least 3-fold higher and had an RPKM >1 in the placenta compared to liver, heart, smooth muscle, adipose, breast, kidney, and lung. High expression is represented in red and low expression in blue.
Figure 2
Figure 2. Genes novel to placental biology
Gene expression analysis via qRT-PCR of A) QSOX1, C) DLG5, and E) SEMA7A in placenta and 7 other tissues. Values are expressed as the fold change relative to placenta ± SD. Representative 40x images of term placenta from 3 subjects were immunostained with B) QSOX1, D) DLG5, and F) SEMA7A. Images (40x) of secondary-only negative controls for rabbit (left) and mouse (right) are depicted at the bottom of the figure.
Figure 3
Figure 3. Developmentally regulated gene families in term placenta
Heat maps depicting the expression of A) FOX, B) SOX, GATA, and TEAD and C) WNT and FZD genes in placental tissue (n=20). Heat map colors red, white, and blue represent high, moderate, and low expression of transcripts, respectively. Details of average gene expression (RPKM) values are provided in supplementary table S1. High-resolution images are provided in supplementary material. Immunostaining of D) FoxO4, E) Gata3, and F) Wnt7a in human placenta. Representative images from 3 subjects were taken at 10x (top) and 40x (bottom) to show cell specific and intercellular localization. A 10x (left) and 40x (right) image of a secondary-only negative control is depicted on the bottom of the figure.

Similar articles

Cited by

References

    1. Sitras V, Fenton C, Paulssen R, Vartun A, Acharya G. Differences in gene expression between first and third trimester human placenta: a microarray study. PLoS One. 2012;7(3):e33294. - PMC - PubMed
    1. Sood R, Zehnder JL, Druzin ML, Brown PO. Gene expression patterns in human placenta. Proc Natl Acad Sci U S A. 2006;103(14):5478–83. - PMC - PubMed
    1. Mikheev AM, Nabekura T, Kaddoumi A, Bammler TK, Govindarajan R, Hebert MF, Unadkat JD. Profiling gene expression in human placentae of different gestational ages: an OPRU Network and UW SCOR Study. Reprod Sci. 2008;15(9):866–77. - PMC - PubMed
    1. Sitras V, Paulssen RH, Gronaas H, Vartun A, Acharya G. Gene expression profile in labouring and non-labouring human placenta near term. Mol Hum Reprod. 2008;14(1):61–5. - PubMed
    1. Shankar K, Zhong Y, Kang P, Blackburn ML, Soares MJ, Badger TM, Gomez-Acevedo H. RNA-seq analysis of the functional compartments within the rat placentation site. Endocrinology. 2012;153(4):1999–2011. - PMC - PubMed

Publication types

MeSH terms