. 2014 Feb 1;386(1):123-34.
doi: 10.1016/j.ydbio.2013.11.020. Epub 2013 Dec 12.

FGF signaling is required for brain left-right asymmetry and brain midline formation

Affiliations

FGF signaling is required for brain left-right asymmetry and brain midline formation

Judith M Neugebauer et al. Dev Biol. .

Abstract

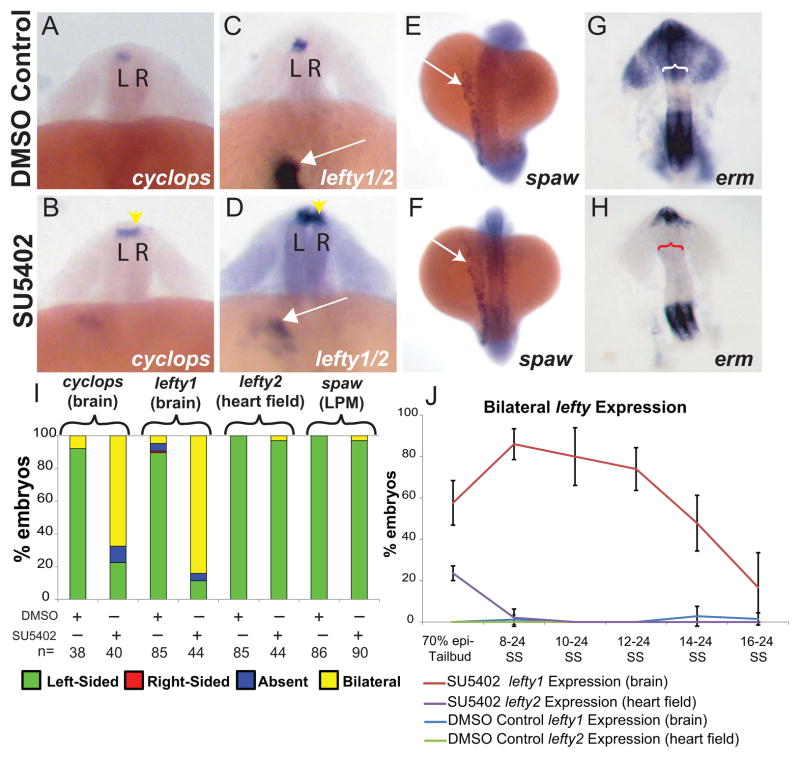
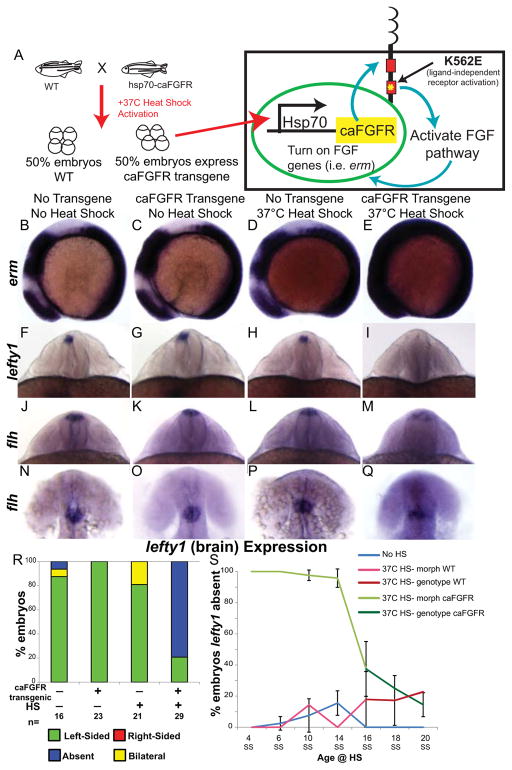
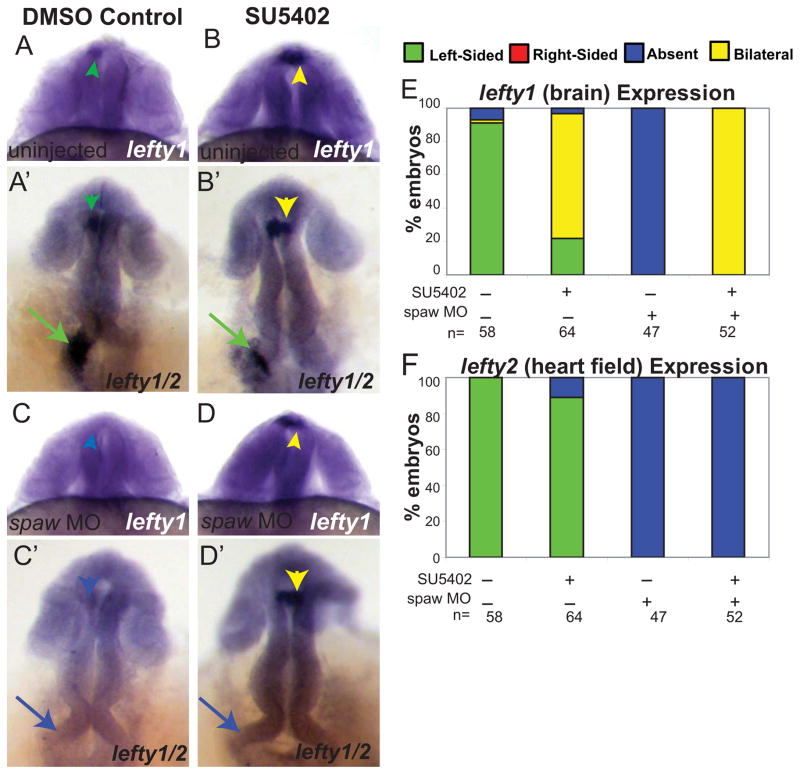
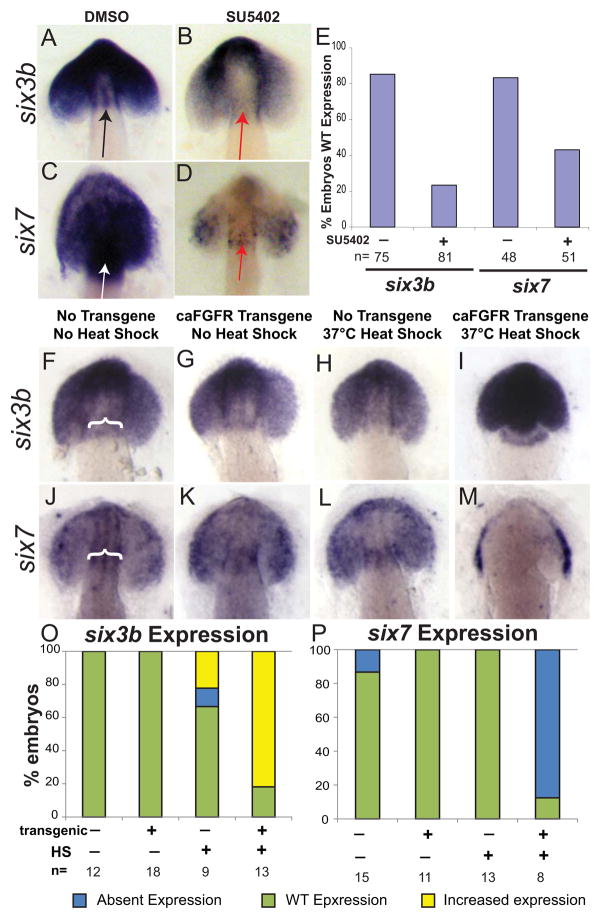
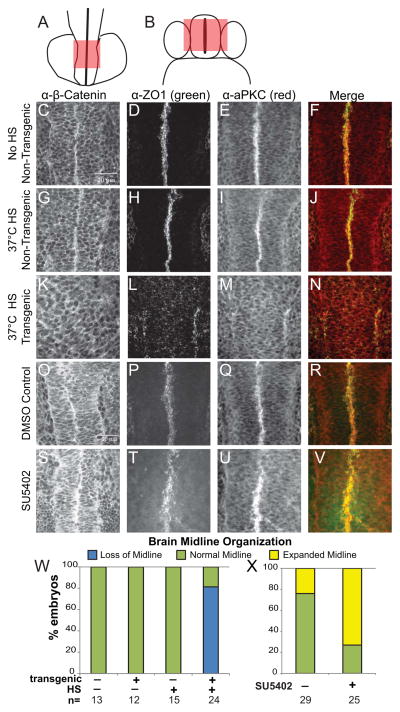
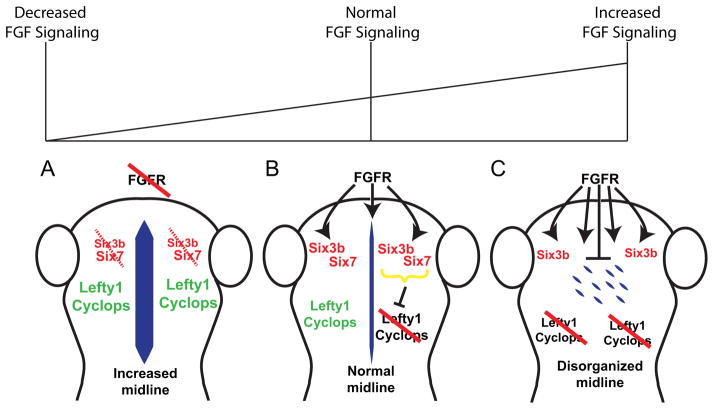
Early disruption of FGF signaling alters left-right (LR) asymmetry throughout the embryo. Here we uncover a role for FGF signaling that specifically disrupts brain asymmetry, independent of normal lateral plate mesoderm (LPM) asymmetry. When FGF signaling is inhibited during mid-somitogenesis, asymmetrically expressed LPM markers southpaw and lefty2 are not affected. However, asymmetrically expressed brain markers lefty1 and cyclops become bilateral. We show that FGF signaling controls expression of six3b and six7, two transcription factors required for repression of asymmetric lefty1 in the brain. We found that Z0-1, atypical PKC (aPKC) and β-catenin protein distribution revealed a midline structure in the forebrain that is dependent on a balance of FGF signaling. Ectopic activation of FGF signaling leads to overexpression of six3b, loss of organized midline adherins junctions and bilateral loss of lefty1 expression. Reducing FGF signaling leads to a reduction in six3b and six7 expression, an increase in cell boundary formation in the brain midline, and bilateral expression of lefty1. Together, these results suggest a novel role for FGF signaling in the brain to control LR asymmetry, six transcription factor expressions, and a midline barrier structure.

Keywords: Brain asymmetry; FGF signaling; Sine occulis.


Figures

Figure 1
Figure 1. FGF dependent control of brain asymmetry is uncoupled from earlier LR patterning
(A–D) Dorsal view of 22–24 somite embryos. L=left, R=right. (A–B) Cyclops is normally expressed in left diencephalon (A; DMSO controls) however when FGF signaling is inhibited, expression becomes bilateral (B; yellow arrowhead. (C–D) Normal left-sided expression of lefty2 within the prospective heart field in the LPM in both DMSO control (C) and SU5402 treated (D) embryos (white arrows). Note that SU5402 was suspended in DMSO in all experiments. Yellow arrowhead indicates bilateral expression of lefty1 in SU5402 treated embryos (D) compared with normal left-sided expression in DMSO treated embryos (C). (E, F) Dorsal view of 18–20 somite embryos showing spaw expression in the LPM. Normal left-sided expression of spaw in the left LPM of SU5402 (F) compared to the DMSO control embryo (E). (G, H) Images of the head dissected from 20 somite embryos showing erm expression (anterior is up). Erm expression is down-regulated in SU5402 treated embryos (H, n=28) in the dorsal diencephalon (red bracket) in comparison to a DMSO control embryo (G, white bracket, n=32). (I) Histogram showing the percentages of embryos displaying normal (left-sided), reversed (right-sided), absent and bilateral expression patterns of cyclops (brain), lefty1 (brain), lefty2 (heart field), spaw (LPM) in SU5402-treated embryos and DMSO-treated embryos. (J) Line graph showing a timeline of SU5402 and DMSO treatments affecting lefty expression in the brain (See Supplemental Figure 1 for all expression classes). 70% epiboly-Tailbud: DMSO n= 29, SU5402=42. 8–24 SS: DMSO n=53, SU5402 n=60. 10–24 SS: DMSO n=49, SU5402 n=57. 12–24 SS: DMSO n=45, SU5402 n=28. 14–24 SS: DMSO n=53, SU5402 n=48. 16–24 SS: DMSO n=64, SU5402 n=37.
Figure 2
Figure 2. FGF pathway controls brain asymmetry
(A) Diagram of heat-shock (HS) activation of the FGF pathway by expression of a constitutively active FGFR1 (caFGFR) protein with a K562E point mutation to activate downstream targets of FGF signaling. (B–E) Lateral view of erm expression in 8 somite embryos. Normal expression of erm in a non-HS’d non-transgenic embryo (B; WT expression 100%, n=24). No up-regulation of erm expression in either a caFGFR transgenic non-HS’d embryo (C; WT expression 100%, n=19) or a non-transgenic HS’d embryo (D; WT expression 93.3%, n=15). However, a dramatic increase in erm expression in a HS’d transgenic embryo (E; Increased expression 73.17%, n=41). (F–I) Dorsoposterior view of 22–24 somite embryos expressing lefty1 (brain). Normal left-sided expression of lefty1 in non-transgenic non-HS’d (F), transgenic non-HS’d (G), and non-transgenic HS’d (H) control embryos. Contrary to normal expression in control embryos lefty1 expression is absent in the brain of transgenic HS’d embryos (I). (J–M) Dorsoposterior and (N–Q) dorsal views of distinct 22–24 somite embryos expressing flh. Normal expression of flh in the dorsal diencephalons of non-transgenic non-HS’d (J, N; n=19 WT expression), transgenic non-HS’d (K, O; n=10 WT expression), and non-transgenic HS’d control embryos (L, P; n= 17 WT expression). Expression of flh is detected in the dorsal brain of caFGFR transgenic HS’d embryos (M, Q; n=23 present but dispersed expression), but appears to be more dispersed. (R) Histogram quantifying the expression of lefty1 in the brain of genotyped embryos. (S) Line graph illustrating the timeline over which FGF signaling controls lefty1 expression in the brain. Embryos that were HS’d caFGFR before 14SS can be clearly identified by changes in morphology, as confirmed by genotyping (panel 2R). Therefore, embryos HS from 4 SS to 14 SS were classed as follows: HS Morph WT (HS non-transgenic siblings), HS Morph caFGFR (HS transgenic siblings). Embryos HS from 16 SS to 20 SS cannot be distinguished by morphological phenotype, so they were individually genotyped, and were classed as follows: HS non-transgenic siblings (HS genotype WT), HS transgenic siblings (HS genotype caFGFR). 4 SS: No HS n=50, 37C HS- morph WT n=27, 37C HS- morph caFGFR n=30; 6 SS: No HS n=91, 37C HS- morph WT n=42, 37C HS- morph caFGFR n=35; 10 SS: No HS n=40, 37C HS- morph WT n=28, 37C HS- morph caFGFR n=29; 14 SS: No HS n=39, 37C HS- morph WT n=34, 37C HS- morph caFGFR n=26; 16 SS: No HS n=51, 37C HS- genotype WT n=27, 37C HS- genotype caFGFR n=30; 18 SS: No HS n=33, 37C HS- genotype WT n=24, 37C HS- genotype caFGFR n=28; 20 SS: No HS n=42, 37C HS- genotype WT n=23, 37C HS- genotype caFGFR n=16.
Figure 3
Figure 3. FGF signaling regulates lefty1 expression in the brain independently of spaw activity
(A–D) Dorsal views of 22–24 somite embryos showing lefty1 in the brain and (A′-D′) different focal plans showing lefty1 in the brain and lefty2 in heart field within the same embryo. Uninjected embryos showing normal left-sided expression of lefty2 in the heart field (green arrows) of both DMSO control embryos and SU5402 treated embryos (A, A′, B, B′). In contrast, bilateral lefty1 expression (yellow arrowhead) in the brain of SU5402 treated embryos in comparison to the normal left-sided expression (green arrowhead) of lefty1 in the DMSO control embryos (A, A′, B, B′). spaw MO injected embryos treated with either DMSO or SU5402 show absence of lefty2 expression in the heart field (blue arrows; C, C′, D, D′). However, SU5402 treated embryos still exhibit bilateral expression of lefty1 in the brain whereas DMSO control embryos no longer express lefty1 (blue arrowhead; C, C′, D, D′). (E) Histogram indicating percentages of embryos displaying normal (left-sided), reversed (right sided), absent and bilateral heart expression patterns of lefty1 for uninjected DMSO control embryos, uninjected SU5402 treated embryos, spaw MO injected DMSO embryos, and spaw MO injected embryos treated with SU5402. (F) Histogram indicating percentages of embryos displaying normal (left-sided), reversed (right-sided), absent and bilateral brain expression patterns of lefty2 for WT DMSO control embryos, WT SU5402 treated embryos, spaw MO injected DMSO embryos, and spaw MO injected embryos treated with SU5402.
Figure 4
Figure 4. FGF signaling controls brain asymmetry through regulation of six3 transcription factor expression
(A, B) Dorsal view of a 12–14 somite embryo with head dissected away from yolk, showing expression of six3b. six3b is expressed broadly in the eye fields and brain, including the dorsal diencephalon (black arrow) of the developing embryo in DMSO control (A; n=75), but is diminished in SU5402 embryos (B; WT=81), including in the diencephalon (red arrow). (C, D) Dorsal view of a 12–14 somite embryo with head dissected away from yolk, showing expression of six7. six7 is expressed broadly in the eye fields and brain, including the dorsal diencephalon (black arrow), of the developing embryo in DMSO control (C; n=48), but is diminished in SU5402 embryos (D; n=51), including in the diencephalon (red arrow). (E) Histogram quantifying the % of embryos expressing WT levels of both six3b and six7 in DMSO Control and SU5402 treated embryos. (F–I) Dorsal view of a 12–14 somite control or caFGFR transgenic embryos, with head dissected away from yolk, showing expression of six3b Embryos were HS activated at 4–6 somites to have maximal activation of FGF signaling at 8 SS to parallel the SU5402 studies. Six3b expression is upregulated in caFGFR transgenic HS’d embryos (I) compared to non-transgenic non HS’d (F; white bracket showing dorsal diencephalon staining), caFGFR transgenic HS’d (G), and non-transgenic HS’d embryos (H). (J–M) Dorsal view of a 12–14 somite control or caFGFR transgenic embryos, with head dissected away from yolk, showing expression of six7. (M) Six7 expression is absent in the dorsal diencephalon of caFGFR transgenic HS’d embryos compared with non-transgenic non HS’d (J; white bracket showing dorsal diencephalon staining), caFGFR transgenic non HS’d (K), and non-transgenic HS’d embryos (L). (O) Histogram quantifying six3b expression in caFGFR genotyped embryos. (P) Histogram quantifying six7 expression in caFGFR genotyped embryos.
Figure 5
Figure 5. Brain midline morphology is disrupted when the balance of FGF signaling is altered
(A) Dorsal view of a 14 somite embryo, red box indicates area imaged by confocal microscopy. (B) To orient the reader, a cross sectional view through the forebrain, red box corresponds to the z-stacks imaged by confocal microscopy. (C–V) Dorsal view of the brain of 16 somite embryos, anterior down, taken at 60X magnification. Z-stacks were taken to encompass the organized midline of the brain, except in the cases where the midline organization was absent and then z-stacks were taken over the entire brain. (C, G, K, O, S) Representative images of α-β-Catenin. (D, H, L, P, T) Representative images of α-ZO1. (E, I, M, Q, U) Representative images of α-aPKC. (F, J, N, R, V) Merged images of both α-ZO1 (green) and α-aPKC (red). HS activated transgenic caFGFR embryos (K–N) appear to lose cellular organization in the midline of the brain compared to non-HS’d controls (C–F) and HS’d non-transgenic siblings (G–J). SU5402 embryos appear to have an increase of midline staining (S–V) compared to DMSO controls (O–R). (W–X) Histograms showing frequency of loss of midline (loss of midline), WT midline (normal) and disorganized midline organization of caFGFR transgenics and siblings (W) and SU5402 and DMSO embryos (X). See Supplementary Table 1 for quantification of midline organization and quantification of markers used.
Figure 6
Figure 6. A balance of FGF activity in the brain controls six3 gene expression, brain midline organization and Left-Right asymmetric lefty1 gene expression
(A) Down-regulation of FGF signaling leads to decreased six3 expression on both sides of the brain and an expansion of brain midline structures. (B) When both FGF signaling and six3 activity are normal, a normal midline structure forms in the brain and allows normal left-sided expression of lefty1. (C) Hyper-activation of FGF signaling increases six3b expression, and other factors, while inhibiting six7 expression. Enhanced FGF-signaling also disrupts brain midline organization. Consequently, lefty1 expression is absent on both sides of the brain, leading to bilateral symmetry (absent expression) that is the opposite of the bilateral symmetry (bilateral expression) seen in the absence of FGF signaling and six3 gene function.

Similar articles

Cited by

References

    1. Taylor RW, Hsieh YW, Gamse JT, Chuang CF. Making a difference together: reciprocal interactions in C. elegans and zebrafish asymmetric neural development. Development (Cambridge, England) 2010;137:681–691. - PMC - PubMed
    1. Halpern ME, Gunturkun O, Hopkins WD, Rogers LJ. Lateralization of the vertebrate brain: taking the side of model systems. The Journal of neuroscience : the official journal of the Society for Neuroscience. 2005;25:10351–10357. - PMC - PubMed
    1. Concha ML, Signore IA, Colombo A. Mechanisms of directional asymmetry in the zebrafish epithalamus. Semin Cell Dev Biol. 2009;20:498–509. - PubMed
    1. Concha ML, Burdine RD, Russell C, Schier AF, Wilson SW. A nodal signaling pathway regulates the laterality of neuroanatomical asymmetries in the zebrafish forebrain. Neuron. 2000;28:399–409. - PubMed
    1. Liang JO, Etheridge A, Hantsoo L, Rubinstein AL, Nowak SJ, Izpisua Belmonte JC, Halpern ME. Asymmetric nodal signaling in the zebrafish diencephalon positions the pineal organ. Development (Cambridge, England) 2000;127:5101–5112. - PubMed

Publication types

MeSH terms

LinkOut - more resources