. 2014 Mar;68(100):87-100.
doi: 10.1016/j.freeradbiomed.2013.12.006. Epub 2013 Dec 12.

Role of intracellular labile iron, ferritin, and antioxidant defence in resistance of chronically adapted Jurkat T cells to hydrogen peroxide

Affiliations

Role of intracellular labile iron, ferritin, and antioxidant defence in resistance of chronically adapted Jurkat T cells to hydrogen peroxide

Abdullah Al-Qenaei et al. Free Radic Biol Med. 2014 Mar.

Abstract

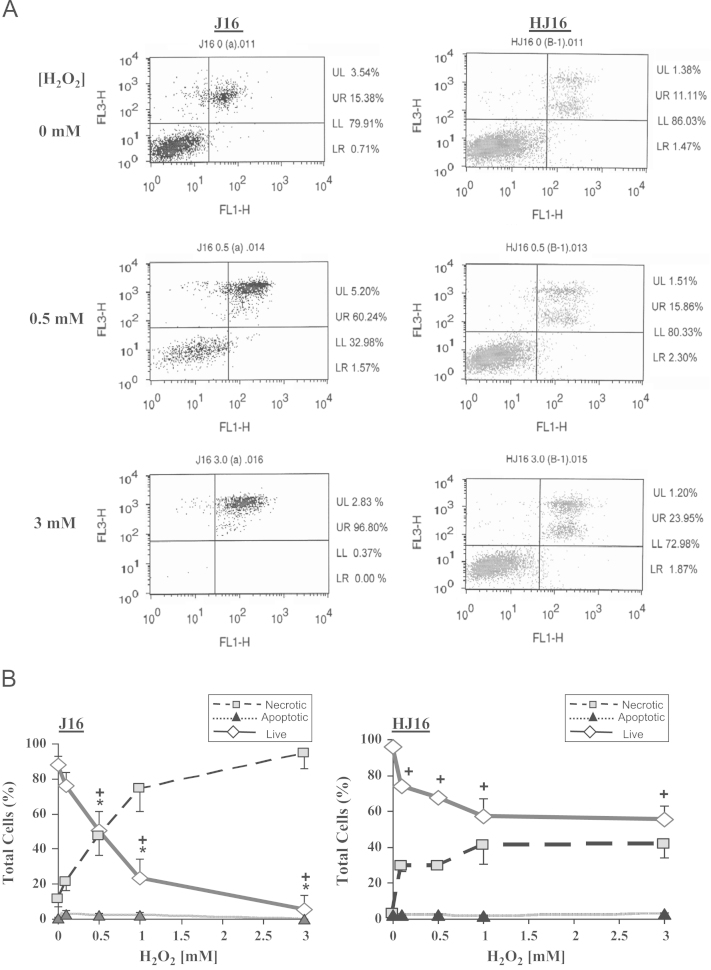
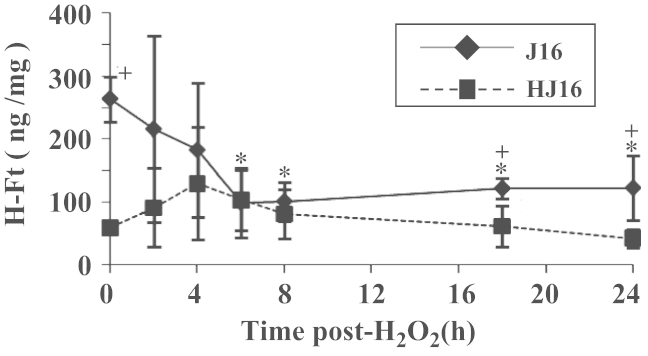
To examine the role of intracellular labile iron pool (LIP), ferritin (Ft), and antioxidant defence in cellular resistance to oxidative stress on chronic adaptation, a new H2O2-resistant Jurkat T cell line "HJ16" was developed by gradual adaptation of parental "J16" cells to high concentrations of H2O2. Compared to J16 cells, HJ16 cells exhibited much higher resistance to H2O2-induced oxidative damage and necrotic cell death (up to 3mM) and had enhanced antioxidant defence in the form of significantly higher intracellular glutathione and mitochondrial ferritin (FtMt) levels as well as higher glutathione-peroxidase (GPx) activity. In contrast, the level of the Ft H-subunit (FtH) in the H2O2-adapted cell line was found to be 7-fold lower than in the parental J16 cell line. While H2O2 concentrations higher than 0.1mM fully depleted the glutathione content of J16 cells, in HJ16 cells the same treatments decreased the cellular glutathione content to only half of the original value. In HJ16 cells, H2O2 concentrations higher than 0.1mM increased the level of FtMt up to 4-fold of their control values but had no effect on the FtMt levels in J16 cells. Furthermore, while the basal cytosolic level of LIP was similar in both cell lines, H2O2 treatment substantially increased the cytosolic LIP levels in J16 but not in HJ16 cells. H2O2 treatment also substantially decreased the FtH levels in J16 cells (up to 70% of the control value). In contrast in HJ16 cells, FtH levels were not affected by H2O2 treatment. These results indicate that chronic adaptation of J16 cells to high concentrations of H2O2 has provoked a series of novel and specific cellular adaptive responses that contribute to higher resistance of HJ16 cells to oxidative damage and cell death. These include increased cellular antioxidant defence in the form of higher glutathione and FtMt levels, higher GPx activity, and lower FtH levels. Further adaptive responses include the significantly reduced cellular response to oxidant-mediated glutathione depletion, FtH modulation, and labile iron release and a significant increase in FtMt levels following H2O2 treatment.

Keywords: ATP; Desferrioxamine; Ferritin; Hydrogen peroxide; Labile iron; Lysosomes; Mitochondria; Mitochondrial ferritin; Necrosis; Oxidative stress; T cell.


Figures

Fig. 1
Fig. 1
(A) An example of the evaluation of flow cytometry analysis 24 h following H2O2 treatment. Cells were treated with 0, 0.5, and 3 mM H2O2. The analysis was performed 24 h after H2O2 treatment following dual Annexin-V/PI staining. Live cells are situated in the lower left quadrant (LL), apoptotic cells are situated in the lower right quadrant (LR), and primary and secondary necrotic cells are situated in the upper left (UL) and upper right (UR) quadrants, respectively. (B) The effect of H2O2 on the percentage of apoptosis and necrosis in J16 and HJ16 cell lines. Cells were treated with H2O2 at final concentrations of 0, 0.5, 1, and 3 mM. The percentages of live, necrotic, and apoptotic cells were scored 24 h following the H2O2 treatment by flow cytometry. The results are expressed as mean ± SD (n=3). + P < 0.05, significant difference between treated and corresponding controls (Live cells). * P < 0.05, significantly different from HJ16 cell line (Live cells).
Fig. 2
Fig. 2
Effect of H2O2 and DFO on the intracellular level of ATP in J16 and HJ16 cells. Cells were first treated or not with 100 µM DFO for 18 h at 37 °C. Cells were then incubated for 45 min in PNG prior to treatment with H2O2 at final concentrations of 0, 0.05, 0.1, 0.5, and 1 mM. The intracellular level of ATP was measured 4 and 24 h following H2O2 treatment with the Apoglow kit. Data are expressed as mean ± SD (n=3–5). A and B are plotted as fold change in ATP when compared to the corresponding untreated control. C–F are plotted as percentage change in ATP when compared to the corresponding untreated control. *P < 0.05, significant difference between J16 and HJ16 cells at 4 or 24 h time points. + P < 0.05, significant difference between DFO-treated and the corresponding untreated cell lines at 4 or 24 h time points. (A) 4h, (B) 24h, (C) J16 4h, (D) HJ16 4h, (E) J16 24h and (F) HJ16 24h.
Fig. 3
Fig. 3
Evaluation of H2O2-mediated damage to lysosomes in J16 and HJ16 cells. Cells were first treated (or not) with 100 µM DFO for 18 h and then exposed to H2O2 at final concentrations of 0, 0.1, 0.5, 1, and 3 mM. The Lysosensor green (A), cathepsin B immunostaining (B), and NR assays (C–E) were performed 24 h following H2O2 treatment as detailed under Materials and methods. For A and B, the photographs are representative of three independent experiments. In B–D, results are expressed as mean ± SD (n=3–5). *P < 0.05, significantly different from the corresponding control. + P < 0.05, significantly different from the corresponding J16 cells.
Fig. 4
Fig. 4
LIP measurements in J16 and HJ16 cells with or without H2O2 treatments. LIP determination was performed immediately after H2O2 treatment. The results are expressed as mean ± SD (n=3–8). *P < 0.05, significantly different from the corresponding HJ16 cells. + P < 0.05, significantly different from the corresponding untreated control.
Fig. 5
Fig. 5
Effect of H2O2 ± DFO treatment on the level of necrotic cell death in J16 and HJ16 cells. Both cell lines were treated with 100 μM DFO for 18 h before H2O2 treatment. Flow cytometry assay was performed 24 h following H2O2 treatment. The results are expressed mean ± SD (n=3). *P < 0.05, significantly different from cells treated with H2O2 alone.
Fig. 6
Fig. 6
FtH and FtL measurements in J16 and HJ16 cell lines ± H2O2 and/or DFO. FtH and FtL measurements were performed by ELISA. For DFO treatment, cells were first treated for 18 h with 100 µM DFO and then the ELISA was performed either immediately (0 h) or following 24 h incubation in conditioned media without DFO. For H2O2 treatments, cells pretreated or not with DFO were analyzed by ELISA either immediately, i.e., H2O2 (0 h) or 24 h after H2O2 treatment, i.e., H2O2 (24 h). The results are expressed as mean ± SD (n=3). *P < 0.05, significantly different from the corresponding untreated control.
Fig. 7
Fig. 7
Modulation of FtH level following treatment of J16 and HJ16 cell lines with 0.5 mM H2O2. Whole cellular extracts from J16 and HJ16 cell lines were first prepared 0, 2, 4, 6, 8, 18, and 24 h after H2O2 treatment with an intermediate dose of 0.5 mM and then analyzed by ELISA. Data are expressed as mean ± SD (n=3). *P < 0.05, significantly different from the corresponding control. + P < 0.05, significantly different from the corresponding value of the other cell line.
Fig. 8
Fig. 8
The effect of H2O2 (+/– BSO) on modulation of intracellular glutathione level and its impact on cell survival. A and B are the determination of total intracellular glutathione level by Tietze’s method 24 h after treatment of J16 (A) and HJ16 (B) cells with various concentrations of H2O2. The results are expressed as mean ± SD (n=3). *P < 0.05, significantly different from the corresponding untreated control. C and D represent the percentage survival of J16 and HJ16 cells as determined by flow cytometry 24 h following H2O2 treatment of cells pretreated (or not) with 25 µM BSO for 18 h. The results are expressed as mean ± SD (n=3). *P < 0.05, significantly different from the corresponding control of the same treatment. + P < 0.05, significantly different from BSO-treated cells.
Fig. 9
Fig. 9
Schematic diagram illustrating the main differences observed in the present study between J16 and HJ16 cells treated or not with H2O2 (A) and/or DFO (B). Abbreviations: GSH, glutathione; GPx, glutathione peroxidase; FtMt, mitochondrial ferritin; FtH, ferritin heavy chain; LIP, labile iron pool. In A after H2O2 treatment, the upward arrows in the boxes indicate increase and downward arrows indicate decrease.
Fig. 10
Fig. 10
Schematic diagram illustrating the potential pathways involved in H2O2-induced cytosolic labile iron release and necrotic cell death in J16 cells. Exposure of J16 cells to H2O2 catalyses the formation of ROS (orange colour) that promotes oxidative damage in lysosomal (1) and mitochondrial (2) membranes. Damage to lysosomal membrane (1) leads to release of lysosomal proteases (1a) that may contribute to Ft degradation (1a.1) and release its iron in the labile form (LI) (hatched arrow). Although the decrease in Ft level in J16 cells may be due to H2O2-mediated suppression of Ft synthesis (3). In this scenario Ft iron does not contribute to the increase in cytosolic LIP. The release of lysosomal proteases (1a) may also contribute to mitochondrial membrane damage (1a.2). The H2O2-mediated damage to mitochondrial membrane (2) leads to interruption of electron chain transport in mitochondrial membrane causing the generation of ROS, loss of the electrochemical gradient across the inner membrane, and ATP depletion (2b). The release of potentially harmful labile iron (LI) in cytosol via routes 1 and 2, along with the preexisting pool of cytosolic LIP, contributes to a massive increase in cytosolic LIP that catalyses the formation of more harmful ROS (in red) that is thought to further exacerbate the peroxidative damage in the lysosomal (1b), mitochondrial (2a), and plasma (4) membranes leading to the loss of organelles’ and plasma membrane’s integrity. The loss of plasma membrane integrity (4b) together with the mitochondrial ATP depletion (2b) results in necrotic cell death.

References

    1. Pourzand C., Tyrrell R.M. Apoptosis, the role of oxidative stress and the example of solar ultraviolet A radiation. Photochem. Photobiol. 1999;70:380–390. - PubMed
    1. Reelfs O., Eggleston I.M., Pourzand C. Skin protection against UVA-induced iron damage by multiantioxidants and iron chelating drugs/prodrug. Curr. Drug Metab. 2010;11:242–249. - PubMed
    1. Sayre L.M., Perry G., Smith M.A. Oxidative stress and neurotoxicity. Chem. Res. Toxicol. 2008;21:172–188. - PubMed
    1. Dröge W. Oxidative stress and aging. Adv. Exp. Med. Biol. 2003;543:191–200. - PubMed
    1. Paravicini T.M., Touyz R.M. Redox signaling in hypertension. Cardiovasc. Res. 2006;71:247–258. - PubMed

Publication types