. 2014 Mar;42(3):218-229.e4.
doi: 10.1016/j.exphem.2013.11.013. Epub 2013 Dec 11.

Flk2/Flt3 promotes both myeloid and lymphoid development by expanding non-self-renewing multipotent hematopoietic progenitor cells

Affiliations

Flk2/Flt3 promotes both myeloid and lymphoid development by expanding non-self-renewing multipotent hematopoietic progenitor cells

Anna E Beaudin et al. Exp Hematol. 2014 Mar.

Abstract

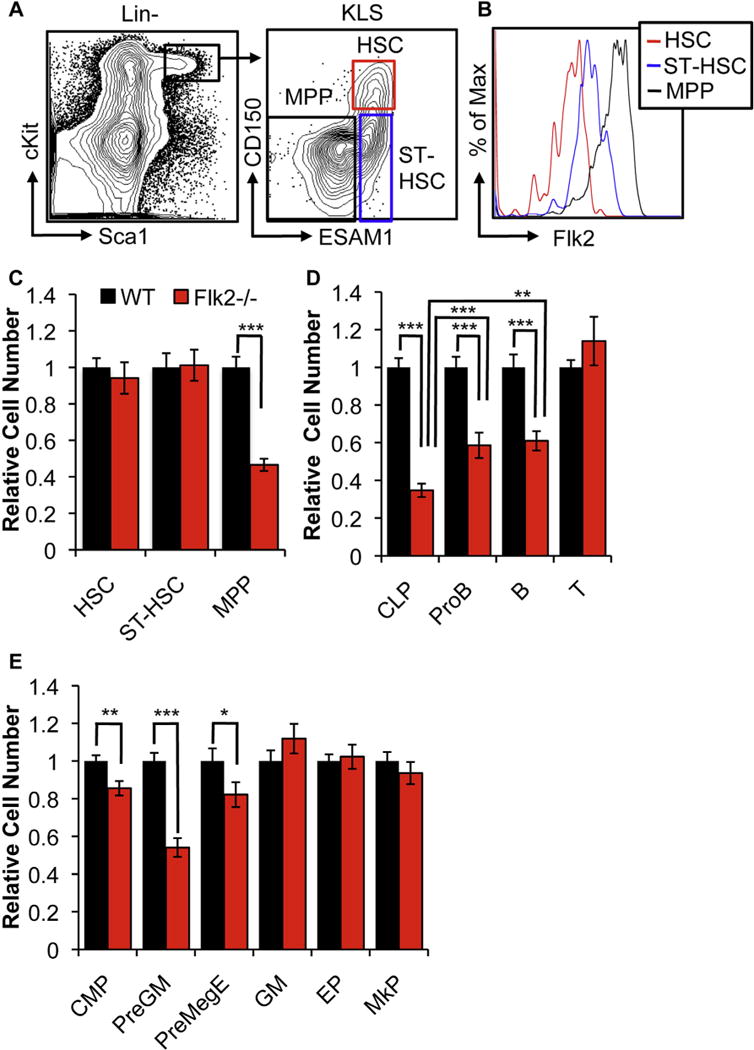
Defining differentiation pathways is central to understanding the pathogenesis of hematopoietic disorders, including leukemia. The function of the receptor tyrosine kinase Flk2 (Flt3) in promoting myeloid development remains poorly defined, despite being commonly mutated in acute myeloid leukemia. We investigated the effect of Flk2 deficiency on myelopoiesis, focusing on specification of progenitors between HSC and mature cells. We provide evidence that Flk2 is critical for proliferative expansion of multipotent progenitors that are common precursors for all lymphoid and myeloid lineages, including megakaryocyte/erythroid (MegE) cells. Flk2 deficiency impaired the generation of both lymphoid and myeloid progenitors by abrogating propagation of their common upstream precursor. At steady state, downstream compensatory mechanisms masked the effect of Flk2 deficiency on mature myeloid output, whereas transplantation of purified progenitors revealed impaired generation of all mature lineages. Flk2 deficiency did not affect lineage choice, thus dissociating the role of Flk2 in promoting cell expansion and regulating cell fate. Surprisingly, despite impairing myeloid development, Flk2 deficiency afforded protection against myeloablative insult. This survival advantage was attributed to reduced cell cycling and proliferation of progenitors in Flk2-deficient mice. Our data support the existence of a common Flk2(+) intermediate for all hematopoietic lineages and provide insight into how activating Flk2 mutations promote hematopoietic malignancy by non-Flk2-expressing myeloid cells.


Conflict of interest statement

Conflict of interest disclosure

No financial interest/relationships with financial interest relating to the topic of this article have been declared.

Figures

Figure 1
Figure 1
Flk2 deficiency decreases cellularity of multipotent, lymphoid, and myeloid progenitors. (A) Flow cytometry gating strategy used to identify Flk2 HSCs, Flk2lo ST-HSCs, and Flk2hi MPPs in Flk2−/− mice. (B) Relative distribution of Flk2 expression levels among the three populations gated in (A). (C) Relative cellularity of multipotent stem and progenitor cells in WT and Flk2−/− mice. (D) Relative cellularity of the lymphoid compartment in WT and Flk2−/− mice. (E) Relative cellularity of the myeloid compartment in WT and Flk2−/− mice. Data represent mean ± SEM of total cell number normalized to WT average for each cell type. Differences were analyzed with two-tailed Student t test. n = 11 per genotype representing three independent experiments. *p < 0.05; **p < 0.01; ***p < 0.001.
Figure 2
Figure 2
Flk2 deficiency impairs HSC reconstitution capacity and lineage output after transplantation. (A) Quantitative and kinetic analysis of donor-derived Tomato+ white blood cells (WBCs) and Plt production in PB of sublethally irradiated mice transplanted with 100 WT or Flk2−/− HSCs. (B) Fold difference in GM, B cell, T cell, and Plt PB reconstitution measured 16 weeks after transplantation for the same mice as in (A). (C) Relative contribution of each mature WBC lineage (GM, B, and T) to total PB reconstitution measured 16 weeks after transplantation for same mice as in (A). (D) Total donor chimerism of each stem, progenitor, and mature cell population in the BM 17–18 weeks after transplantation in the same mice as in (A). Data represent mean ± SEM of the frequency of donor-derived cells for each population. n = 16 per genotype, representing three independent experiments. Differences were analyzed with two-tailed Student t test. *p < 0.05; **p < 0.01; ***p < 0.001.
Figure 3
Figure 3
Flk2 deficiency impairs multilineage reconstitution from ST-HSCs but not MPPs. Multilineage reconstitution kinetics of transplanted WT and Flk2−/− progenitors. (A) Quantitative and kinetic analysis of Tomato+ GM, Plt, B, and T cells derived from 200 WT or Flk2−/− ST-HSCs transplanted into sublethally irradiated recipients (n = 14, representing two independent experiments). (B) Quantitative and kinetic analysis of Tomato+ total GM, Plt, B, and T cells derived from 2000 WT or Flk2−/− MPPs transplanted into sublethally irradiated recipients. n = 9 per genotype, representing two independent experiments. Note the difference in x axis scale in panel A (weeks) and B (days). Differences were analyzed with two-tailed Student t test. *p < 0.05; **p < 0.01; ***p < 0.001.
Figure 4
Figure 4
Flk2 expression does not account for differences in CFU-S efficiency between HSCs and MPPs. (A) Frequency of GM, megakaryocytes (Meg), and erythroid progenitors (EP) on day 11 CFU-S formed from transplanted HSCs or MPPs. (B) CFU-S frequency was not significantly different between transplanted Flk2−/− and WT HSCs (100 cells; n = 9–10, representing two independent experiments), ST-HSCs (200 cells; n = 22, representing three separate experiments), or MPPs (500 cells; n = 18–19, representing three independent experiments). (C) Percent cell recovery in blood, spleen, and BM 3 hours after transplantation of HSCs (Tom+) and MPPs (GFP+) into lethally irradiated recipients (n = 13, representing three independent experiments). (D) Frequency of CFU-S observed on day 12 following injection of WT HSCs IV (100 cells) or IS (10 cells) into lethally irradiated recipients. (E) Frequency of CFU-S observed on day 11 following injection of WT MPPs IV (500 cells) or IS (50 cells) into lethally irradiated recipients. (F) Comparison of colony frequency of WT HSCs and MPPs following IV injection. (G) Comparison of CFU-S frequency of WT HSCs and MPPs following IS injection. n = 12–14 per condition, representing three independent experiments. Differences were analyzed with two-tailed Student t test. *p < 0.05; **p < 0.01; ***p < 0.001.
Figure 5
Figure 5
Flk2 deficiency enhances survival in response to 5-FU, but impairs proliferation. (A) Percent survival of Flk2−/− and WT mice over 8 weeks in response to treatment with 110 mg/kg 5-FU. Arrows indicate time of dosing. More Flk2−/− mice survived after 8 weeks as compared with WT mice (Fisher exact test, p < 0.05). n = 32–33 per genotype, representing four independent experiments. (B) Representative microscope images of FACS-sorted HSCs, MPPs (WT and Flk2−/−), and MyPro labeled with EdU 1 hour after injection. (C) Quantification of the percentage of cells labeled with EdU for each progenitor subtype. Significantly less proliferation was observed in Flk2-deficient MPPs (p < 0.01, paired Student t test). n = 6 per genotype, representing three independent experiments. (D) Representative FACS plots of DNA content for WT and Flk2−/− HSCs, ST-HSCs, MPPs, and myeloid progenitors (MyPro) as determined by propidium iodine staining. Brackets demarcate the percentage of cells in S/G2/M phase. (E) Quantification of the percentage of cells in S/G2/M phase for each progenitor subtype at steady state. n = 5–7 mice per genotype, representing three independent experiments. Differences were analyzed with two-tailed Student t test.*p < 0.05; **p < 0.01; ***p < 0.001.

References

    1. Adolfsson J, Mansson R, Buza-Vidas N, et al. Identification of Flt3+ lympho-myeloid stem cells lacking erythro-megakaryocytic potential a revised road map for adult blood lineage commitment. Cell. 2005;121:295–306. - PubMed
    1. Hunte BE, Hudak S, Campbell D, Xu Y, Rennick D. flk2/flt3 ligand is a potent cofactor for the growth of primitive B cell progenitors. J Immunol. 1996;156:489–496. - PubMed
    1. Hudak S, Hunte B, Culpepper J, et al. FLT3/FLK2 ligand promotes the growth of murine stem cells and the expansion of colony-forming cells and spleen colony-forming units. Blood. 1995;85:2747–2755. - PubMed
    1. Hirayama F, Lyman SD, Clark SC, Ogawa M. The flt3 ligand supports proliferation of lymphohematopoietic progenitors and early B-lymphoid progenitors. Blood. 1995;85:1762–1768. - PubMed
    1. Adolfsson J, Borge OJ, Bryder D, et al. Upregulation of Flt3 expression within the bone marrow Lin(−)Sca1(+)c-kit(+) stem cell compartment is accompanied by loss of self-renewal capacity. Immunity. 2001;15:659–669. - PubMed

Publication types

MeSH terms