. 2014 Mar;185(3):427-39.
doi: 10.1016/j.jsb.2013.12.003. Epub 2013 Dec 12.

Combined approaches to flexible fitting and assessment in virus capsids undergoing conformational change

Affiliations

Combined approaches to flexible fitting and assessment in virus capsids undergoing conformational change

Arun Prasad Pandurangan et al. J Struct Biol. 2014 Mar.

Abstract

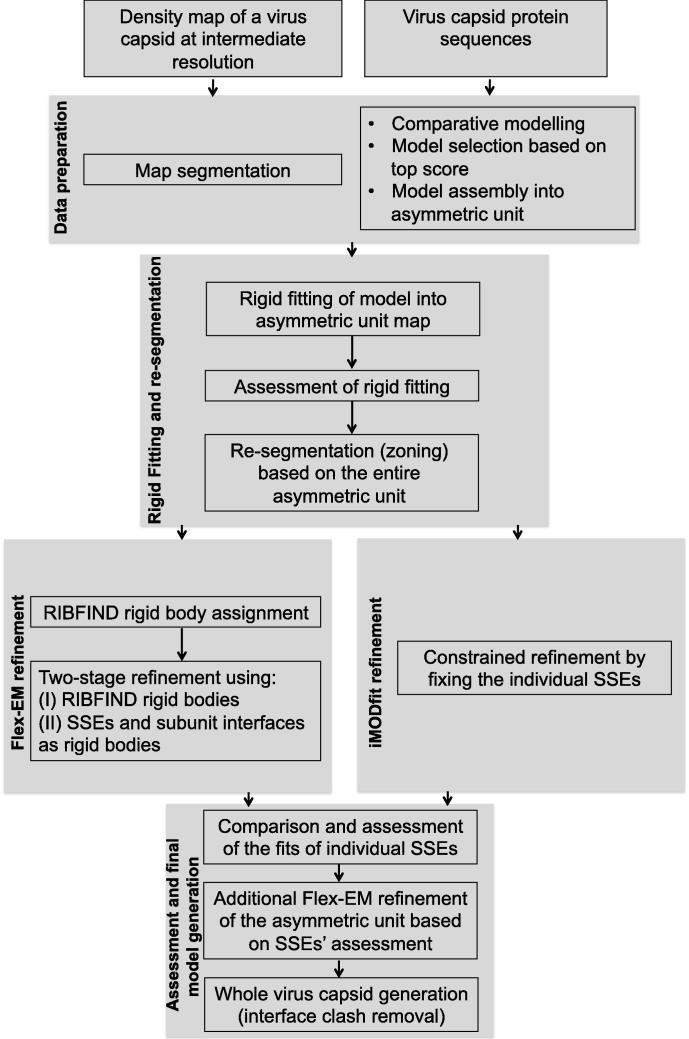
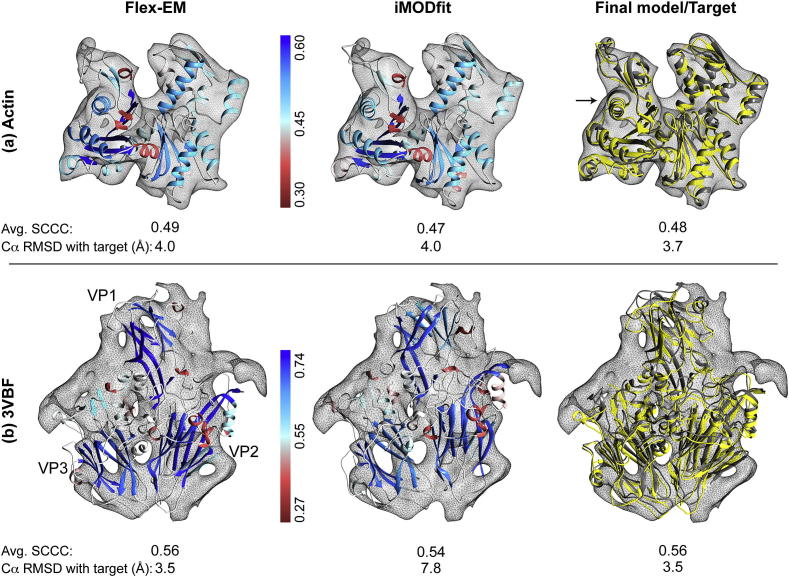
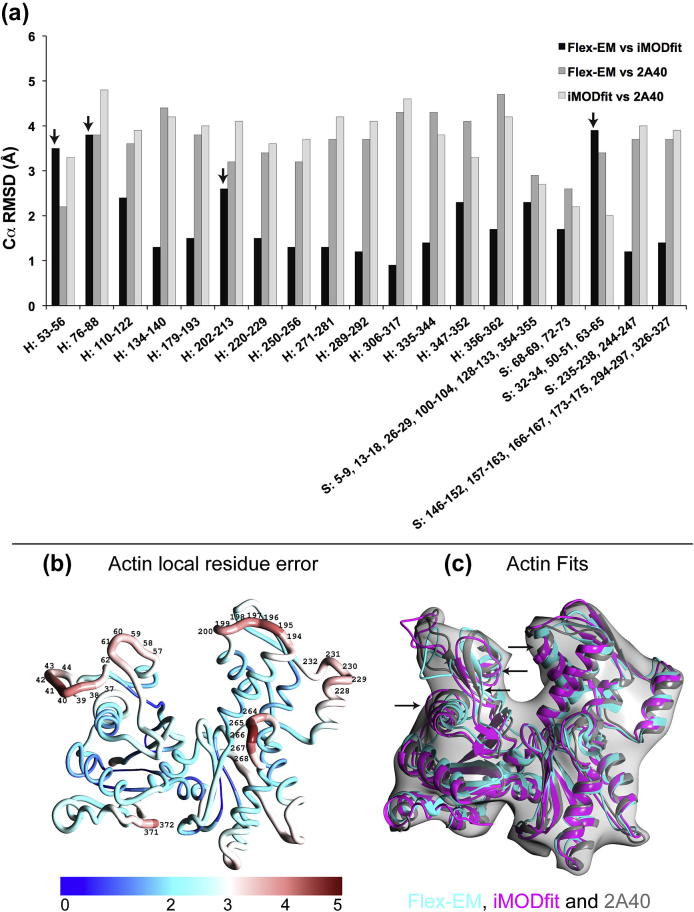
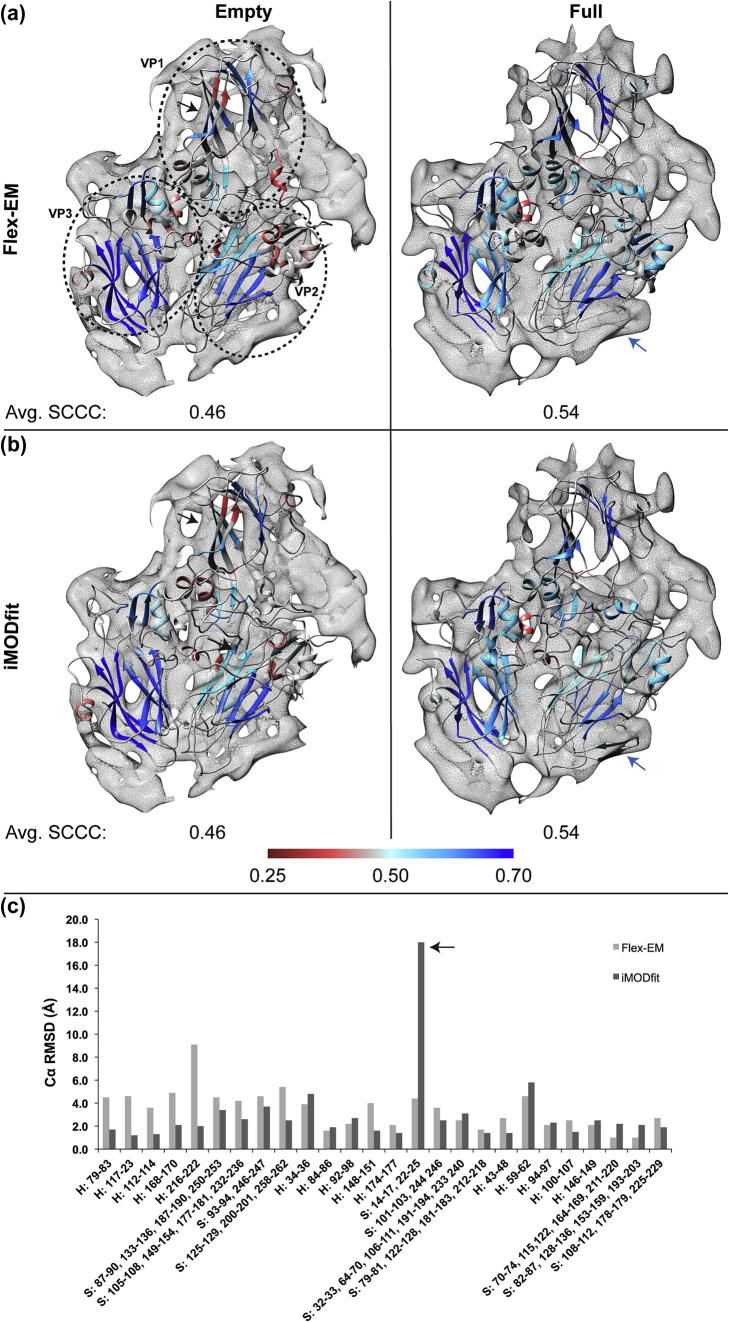
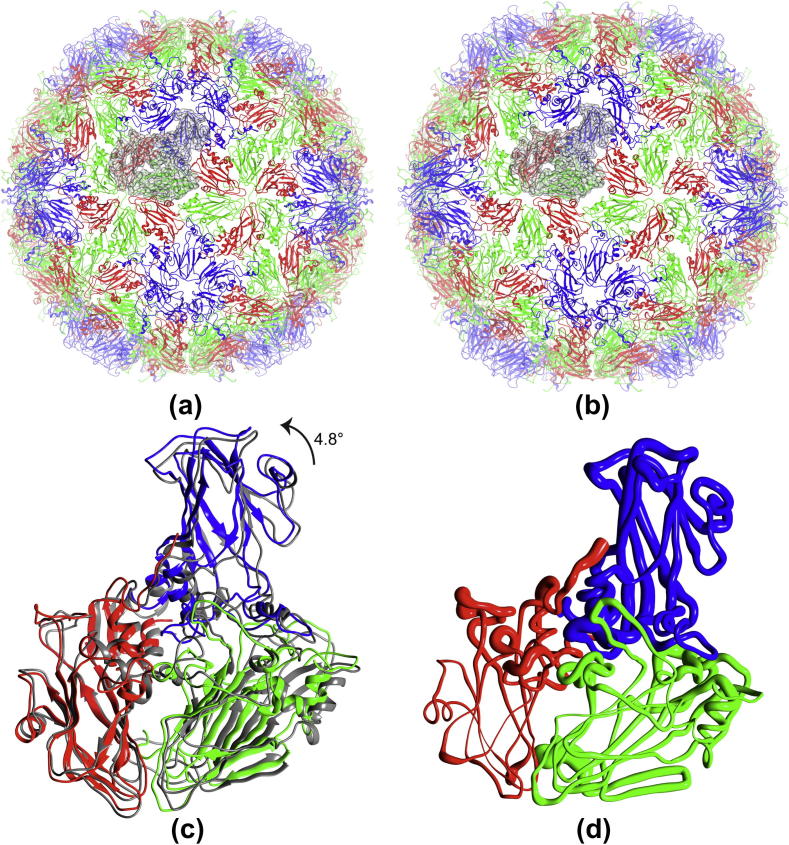
Fitting of atomic components into electron cryo-microscopy (cryoEM) density maps is routinely used to understand the structure and function of macromolecular machines. Many fitting methods have been developed, but a standard protocol for successful fitting and assessment of fitted models has yet to be agreed upon among the experts in the field. Here, we created and tested a protocol that highlights important issues related to homology modelling, density map segmentation, rigid and flexible fitting, as well as the assessment of fits. As part of it, we use two different flexible fitting methods (Flex-EM and iMODfit) and demonstrate how combining the analysis of multiple fits and model assessment could result in an improved model. The protocol is applied to the case of the mature and empty capsids of Coxsackievirus A7 (CAV7) by flexibly fitting homology models into the corresponding cryoEM density maps at 8.2 and 6.1Å resolution. As a result, and due to the improved homology models (derived from recently solved crystal structures of a close homolog - EV71 capsid - in mature and empty forms), the final models present an improvement over previously published models. In close agreement with the capsid expansion observed in the EV71 structures, the new CAV7 models reveal that the expansion is accompanied by ∼5° counterclockwise rotation of the asymmetric unit, predominantly contributed by the capsid protein VP1. The protocol could be applied not only to viral capsids but also to many other complexes characterised by a combination of atomic structure modelling and cryoEM density fitting.

Keywords: Coxsackievirus A7; Electron cryo-microscopy; Flexible fitting; Model assessment; Picornaviridae.


Figures

Fig.1
Fig.1
Protocol describing various stages involved in the modelling of viral capsids in the context of cryoEM data. The protocol starts with the data preparation step, which involves segmenting the asymmetric unit density from the virus capsid map and obtaining the atomic model derived using comparative modelling (in case there is no model available from an experimental technique). The rigid fitting and re-segmentation step provides a good starting fit for flexible fitting, which is performed in the next step by two independent methods (here Flex-EM (Topf et al., 2008) and iMODfit (Lopez-Blanco and Chacon, 2013). The final step involves the local assessment of fits produced by the two different methods, further refinement of identified regions needing improvement, and generation of the whole capsid model (including the identification and removal of clashes). In general, for a given input map and a rigid fit, except for the capsid assembly generation, the steps in the protocol can also be applied to non-viral capsid systems.
Fig.2
Fig.2
Comparison of fits obtained using Flex-EM, iMODfit and the final refined model. (a) Fits of the homology model of actin into the simulated map obtained using Flex-EM (left) and iMODfit (middle), and the final refined model (shown in yellow) in comparison with the target fit (PDB ID: 2A40, shown in grey) (right). (b) Fits of the asymmetric unit of EV71 mature capsid into the procapsid map of EV71 obtained using Flex-EM (left), iMODfit (middle) and the final refined model (shown in yellow) in comparison with the target fit (PDB ID: 4GMP, shown in grey) (right). In (a) and (b) the Flex-EM and iMODfits models are coloured based on their respective segment-based cross correlation score of individual SSEs (SCCC, see Methods). The colour gradient for each SSE was selected based on its respective SCCC score using the Render by Attribute function in Chimera (Pettersen et al., 2004). The averaged SCCC score over all SSEs is indicated below each fit. The colour gradient scales in panel (a) and (b) are shown as vertical bars. In (a), the arrow points to the fit (helix residues 76–88) that improved during the refinement of the final model.
Fig.3
Fig.3
Analysis of Cα RMSDs for individual SSEs and modelling errors for the case of flexible fitting of actin subunit homology model into the simulated map. In (a) three different RMSD comparisons are shown (Flex-EM vs. iMODfit, Flex-EM vs. target fit and iMODfit vs. target fit). The target fit corresponds to the PDB ID 2A40. (b) The actin homology model coloured using the QMEAN local residue error values (in Å) from the lowest (blue) to the highest (red). The range of local residue error values and its corresponding colour gradient is shown below (b). Error values above 3.5 Å that are considered unreliable are labelled. (c) Comparison of flexible fits obtained using Flex-EM (cyan), iMODfit (magenta) and the target fit (PDB ID 2A40) (grey). The arrows in (c) shows SSEs (helices 53–56, 76–88 and 202-213, and the sheet 32–34, 50–51, 63–65) with low consensus fit (Cα RMSD between Flex-EM and iMODfit >2.50 Å). The four SSEs are directly linked to the unreliable loops shown in (b).
Fig.4
Fig.4
Comparison of Flex-EM and iMODfit based model fitting in asymmetric maps of CAV7 empty and full capsid. (a) Fitting of VP1, 2 and 3 models into the asymmetric unit of empty and full maps using Flex-EM. Each protein is shown within a circle (left). (b) Fitting of VP1, 2 and 3 models into the asymmetric unit of empty and full map using iMODfit. The individual SSEs within the fitted models are coloured based on their segment-based cross correlation score (SCCC, see Methods). The averaged SCCC score of all SSEs is indicated below each fit. The colour gradient for each SSE was selected based on its respective SCCC score using the Render by Attribute function in Chimera and its scale is described below the figure. Black arrows indicate a β-sheet (strands 87–90, 133–136, 187–190, 250–253), which is fitted better using Flex-EM. Blue arrows indicate the β-hairpin (residues 14–17, 22–25) that is likely to be overfitted by iMODfit. (c) Comparison of Cα RMSDs for individual SSEs between the CAV7 empty and full fits of Flex-EM and iMODfit. X-axis indicates the SSE residue range with prefix indicating the type of SSE (H: for helix and S: for β-sheet). The arrow highlights the large conformational change observed by iMODfit for β-hairpin (residues 14–17, 22–25), which is likely to be a result of overfitting (see also in (a) and (b)).
Fig.5
Fig.5
Pseudo atomic models of CAV7 empty and full capsids. (a and b) Fitted model for the complete full and the empty capsids, respectively. EM density for one asymmetric unit is shown as transparent surface in the background in both. (c) Conformational changes at an asymmetric unit level between full (coloured grey) and empty (non-grey) capsids shown by superposing the final models of the full and empty asymmetric unit. (d) Structural differences mapped onto the empty asymmetric unit using the worm representation. The thickness of the worm from smallest to largest reflects the local deviation (per-residue backbone RMSD) from smallest to largest between the empty and full asymmetric units. The backbone RMSD ranges between 0.46 and 12.45 Å. In (a–d) VP1, 2 and 3 are coloured as blue, green and red, respectively.

Similar articles

Cited by

References

    1. Abrescia N.G., Cockburn J.J., Grimes J.M., Sutton G.C., Diprose J.M. Insights into assembly from structural analysis of bacteriophage PRD1. Nature. 2004;432:68–74. - PubMed
    1. Ahmed A., Tama F. Consensus among multiple approaches as a reliability measure for flexible fitting into cryo-EM data. J. Struct. Biol. 2013;182:66–67. - PubMed
    1. Ahmed A., Whitford P.C., Sanbonmatsu K.Y., Tama F. Consensus among flexible fitting approaches improves the interpretation of cryo-EM data. J. Struct. Biol. 2012;177:561–570. - PMC - PubMed
    1. Bajaj C., Yu Z., Auer M. Volumetric feature extraction and visualization of tomographic molecular imaging. J. Struct. Biol. 2003;144:132–143. - PubMed
    1. Baker T.S., Olson N.H., Fuller S.D. Adding the third dimension to virus life cycles: three-dimensional reconstruction of icosahedral viruses from cryo-electron micrographs. Microbiol. Mol. Biol. Rev. 1999;63:862–922. - PMC - PubMed

Publication types