Comparative Study
. 2014 Jan 2;55(1):1-15.
doi: 10.1167/iovs.13-12724.

Eye-specific IOP-induced displacements and deformations of human lamina cribrosa

Affiliations
Comparative Study

Eye-specific IOP-induced displacements and deformations of human lamina cribrosa

Ian A Sigal et al. Invest Ophthalmol Vis Sci. .

Abstract

Purpose: To measure high-resolution eye-specific displacements and deformations induced within the human LC microstructure by an acute increase in IOP.

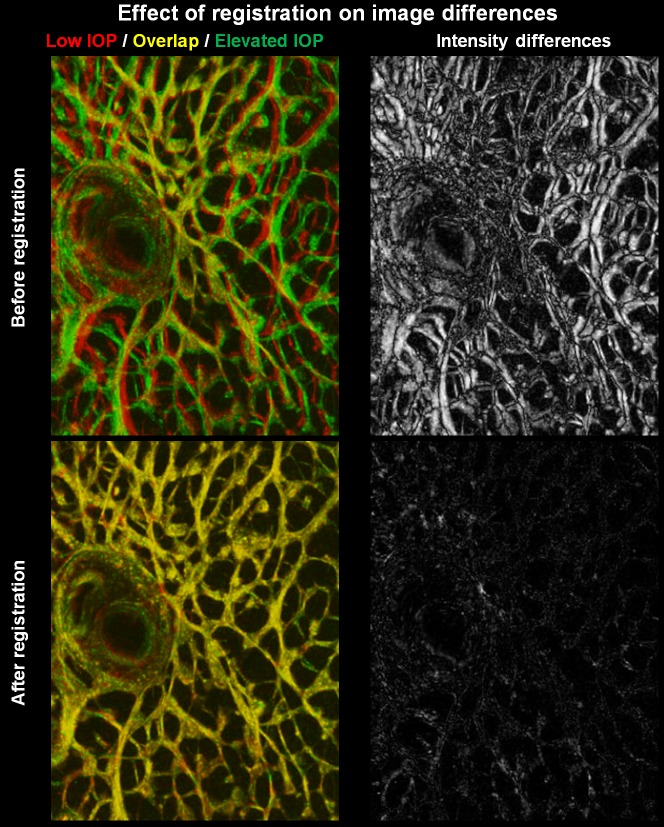
Methods: Six eyes from donors aged 23 to 82 were scanned using second harmonic-generated (SHG) imaging at various levels of IOP from 10 to 50 mm Hg. An image registration technique was developed, tested, and used to find the deformation mapping between maximum intensity projection images acquired at low and elevated IOP. The mappings were analyzed to determine the magnitude and distribution of the IOP-induced displacements and deformations and contralateral similarity.

Results: Images of the LC were obtained and the registration technique was successful. IOP increases produced substantial, and potentially biologically significant, levels of in-plane LC stretch and compression (reaching 10%-25% medians and 20%-30% 75th percentiles). Deformations were sometimes highly focal and concentrated in regions as small as a few pores. Regions of largest displacement, stretch, compression, and shear did not colocalize. Displacements and strains were not normally distributed. Contralateral eyes did not always have more similar responses to IOP than unrelated eyes. Under elevated IOP, some LC regions were under bi-axial stretch, others under bi-axial compression.

Conclusions: We obtained eye-specific measurements of the complex effects of IOP on the LC with unprecedented resolution in uncut and unfixed human eyes. Our technique was robust to electronic and speckle noise. Elevated IOP produced substantial in-plane LC stretch and compression. Further research will explore the effects of IOP on the LC in a three-dimensional framework.

Keywords: biomechanics; glaucoma; lamina cribrosa; optic nerve head; second harmonic imaging; strain.


Figures

Figure 1
Figure 1
En-face SHG images of the LC of a 79-year-old eye (donor 2 OD) at normal (left) and elevated IOP (right). The borders of the scleral canal were segmented manually and the LC isolated for analysis. Note the rich horizontal (in-plane) trabecular structure characteristic of the laminar region visible without the need for labeling and with the neural tissues present.
Figure 2
Figure 2
Demonstration of the image registration technique. Close ups of the LC of donor 1 before (top) and after (bottom) registration. The left side shows images acquired at low (green) and elevated IOP (red) to visualize the differences and overlap (yellow). The differences before registration cannot be removed by simple translation or rotation. The right side shows the differences in image intensity with the largest differences in white and smallest differences in black. The registration produced excellent coincidence between the images, without concentrations. The largest differences are due to noise and intensity variations that result in slightly greenish or reddish regions despite coincidence of LC features. Another useful visualization of the good results obtained from the registration is to use image flickering, as in the supplemental animation (Supplementary Movie S1) of a detail on the temporal side (right side of the image).
Figure 3
Figure 3
Effect of the registration technique on the distribution of differences in image intensity. We compared image intensities (pixel by pixel) between the SHG images acquired at low and elevated IOP before (left) and after (right) applying our image registration technique. Both comparisons above were done after registering the image centers of mass. The panels are density plots, akin to 2D histograms, where the brightness of a region is proportional to the number of cases. Notice the much wider cloud before registration, indicating large differences between images. Please see Supplementary Figure S1 for a binned Bland-Altman plot further illustrating the effects of registration.
Figure 4
Figure 4
Applying the image registration technique. These animations show IOP-induced displacements and deformations produced by the increase in IOP from 10 to 45 mm Hg that are difficult to distinguish otherwise. Note the variations in beam thickness and pore sizes even within small regions. A small vessel can be distinguished in the LC close-up of donor 2 OD (C), which deforms differently from the surrounding tissues. The animations corresponding to (A), (B), (C), and (D) are 2, 3, 4, and 5, respectively.
Figure 5
Figure 5
Effects of IOP. Displacement (top row) and deformations (middle and bottom rows) induced within the LC of donor 2 OD by an increase in IOP from 10 to 45 mm Hg. Shown are contour levels of displacement magnitude (top left) and displacement vectors on 5000 randomly selected points on the LC colored by the displacement magnitude (top right). The deformations are shown with contour-level plots of the magnitude of in-plane stretch (left column), compression (middle column), and shear (right column). To better appreciate the relationship between the deformations and the structures of the LC we show the contour levels of deformation (middle row) and the LC structure as imaged by SHG colored by the stretch, compression, and shear (bottom row). In-plane displacements are of the order of the anterior-posterior displacements measured by using OCT, as predicted by modeling., Displacements, and compressive and shear deformations were smaller near the main vessels. The regions of largest displacement, stretch, compression, and shear did not colocalize. Shear strains in this eye did not have as high peaks as the stretch or compression.
Figure 6
Figure 6
Detail of the biomechanical effects of IOP. To better appreciate the local nature of the effects of IOP we show in this figure a detail of the peripheral region of donor 2 OD. The panels show the structure of the LC in the SHG image (top left), as well as the SHG image colored by the magnitudes of displacement (top right), stretch (bottom left), compression (bottom center), or shear (bottom right). Notice the concentration of compressive strains in two pores that appear otherwise unremarkable. These pores are not highlighted by either the displacements or other modes of deformation.
Figure 7
Figure 7
Image differences before and after registration. Pixel-by-pixel comparisons of differences in intensity between the images acquired at low and elevated IOP before (top) and after (bottom) image registration (donor 2, OD). Shown are whole LCs (left) and details (right) of the peripheral region in Figure 6. Largest differences are shown in white and smallest differences in black. Note the uniform distribution of differences after registration, demonstrating that the local effects shown in Figure 6 are not an artifact of the registration.
Figure 8
Figure 8
Distributions of displacements and deformations for the LCs of six eyes. Positive strains represent tissue stretch, whereas negative strains represent tissue compression. Shown is the absolute value of the shear strain. Clearly the increases in IOP produced substantial displacements and levels of strain that have been demonstrated to be of biological significance.,, Notice that the effects of IOP were similar between the eyes of donor 3, but notably different between the eyes of donor 4. The scale of the images acquired from the LC of donor 1 could not be ascertained reliably, and therefore we excluded the displacements computed from it from analysis. Recall that zero strain corresponds with no IOP-induced deformation, while still allowing for local translation.
Figure 9
Figure 9
Sensitivity to noise. The robustness to image noise was evaluated by adding various levels of noise to the images before registration. Electronic noise was approximated by a Gaussian distribution with mean zero and SD of 4%, 8%, 12% (not shown), and 16%. Speckle noise was approximated as described in the text using a negative exponential function producing noise with SD of 12% and 17%. Data in this figure are for the LC of donor 2 OD. The top row shows details of the LC of donor 2 baseline image (left) and with added noise. The middle row shows box plots of the distributions of first and second principal strains (magnitudes). Adding noise had only small effects on the quartiles of the principal strain, although a few differences were noted on the extremes (5th and 95th percentiles). The bottom row shows contour level plots of the differences in magnitude of displacement (absolute values, left side), compression (middle), and stretch (right). Comparing the plots with those in Figure 5 shows that the displacements and deformations were highly robust to noise. As in Figures 5 and 6, the brightness of the contour levels of displacement and deformation is mapped to the intensity of the SHG images, simplifying seeing the tissue structure.
Figure 10
Figure 10
Two-dimensional distributions of principal strains illustrating modes of deformation and contralateral eye similarity/differences. The panels show density plots, with darker regions representing larger LC areas with the corresponding magnitudes of first and second principal strains. By definition, the principal strains are orthogonal and the first principal strain is greater than the second principal strain. Hence there are no measurements below the identity line. Positive strains correspond to tissue stretch and negative strains to tissue compression. Note that our analyses did not enforce conservation of volume. When both principal strains are positive (top right quadrant), the tissue is stretched in all directions (bi-axial stretch). When both principal strains are negative (bottom left quadrant), the tissue is compressed in all directions (bi-axial compression). When one principal strain is positive and the other negative (top left quadrant), the tissue is stretched in one direction and compressed in the other, in a state of shear. The special cases when both principal strains are equal correspond to equi-bi-axial stretch, equi-bi-axial compression, or the trivial case with no deformation (the origin). Recall that zero deformation does not have to imply zero displacement. Note the high magnitude of the deformations in most eyes, with strains in some small regions reaching into the 30% and 40%, consistent with the plots of Figure 8. Donor 4 OD suffered no bi-axial compressive strains, and was therefore in tension or shear. Thus, the effects of IOP on donor 4 OD were substantially different from those on donor 4 OS, and did not just differ on magnitude.
Figure 11
Figure 11
Spatial distribution of the modes of deformation of the LC of donor 2. Illustration of the spatial distribution of the three modes of deformation described in Figure 6. The colors represent whether locally the tissue is under bi-axial stretch (red), bi-axial compression (blue), or shear (green). In the plot on the left, the color intensity corresponds to the magnitude of the effect (distance from the origin in Figure 10), such that white represents zero deformation. In the plot on the right we used only red, green, and blue to color the SHG image to illustrate the spatial distribution of the modes, and overlaid the colors on the SHG image to show how the modes of deformation correspond with the LC structure. Note how the region near the vessels is in bi-axial stretch and most of the bi-axial compression occurs in the peripheral LC, often concentrated on specific pores.

Comment in

Similar articles

Cited by

References

    1. Resnikoff S, Pascolini D, Etya'ale D, et al. Global data on visual impairment in the year 2002. Bull World Health Organ. 2004; 82: 844–851 - PMC - PubMed
    1. Quigley HA. Glaucoma: macrocosm to microcosm the Friedenwald lecture. Invest Ophthalmol Vis Sci. 2005; 46: 2662–2670 - PubMed
    1. Minckler DS, Bunt AH, Johanson GW. Orthograde and retrograde axoplasmic transport during acute ocular hypertension in the monkey. Invest Ophthalmol Vis Sci. 1977; 16: 426–441 - PubMed
    1. Quigley HA. Neuronal death in glaucoma. Prog Retin Eye Res. 1999; 18: 39–57 - PubMed
    1. AGIS Investigators The Advanced Glaucoma Intervention Study (AGIS): 7. The relationship between control of intraocular pressure and visual field deterioration. The AGIS Investigators. Am J Ophthalmol. 2000; 130: 429 - PubMed

Publication types