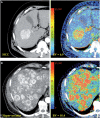
Quantitative characterization of hepatocellular carcinoma and metastatic liver tumor by CT perfusion
- PMID: 24334461
- PMCID: PMC3864227
- DOI: 10.1102/1470-7330.2013.0040
Quantitative characterization of hepatocellular carcinoma and metastatic liver tumor by CT perfusion
Abstract
Purpose: To evaluate the diagnostic value of computed tomography perfusion (CTP) in the distinction of hepatocellular carcinomas (HCCs) from metastatic liver tumors.
Materials and methods: CTP data from 90 liver tumors (HCC 38, metastasis 52) in 31 patients (16 men and 15 women; mean age 60.3 years) were studied. CTP was performed on a 16/64 multidetector-row CT scanner using a 30-s duration cine acquisition after rapid bolus injection (5-7 ml/s) of 50-70 ml of iodinated contrast medium. The CTP data were analyzed using a deconvolution model. Metastatic tumors were grouped into hypovascular (n = 36) and hypervascular (n = 16) tumors.
Results and conclusion: The hypovascular metastases showed a significantly lower blood flow (BF) and blood volume (BV), and higher mean transit time (MTT) than HCC (all P < 0.0001). BF, BV, and MTT of HCCs were substantially lower than those of hypervascular metastases (P = 0.02, P < 0.0001, P = 0.03, respectively). A receiver-operating characteristic analysis showed that BV was a useful marker to distinguish HCCs from hypervascular metastases.
Figures


Similar articles
-
Perfusion CT in cirrhotic patients with early stage hepatocellular carcinoma: assessment of tumor-related vascularization.Eur J Radiol. 2010 Jan;73(1):148-52. doi: 10.1016/j.ejrad.2008.10.014. Epub 2008 Dec 2. Eur J Radiol. 2010. PMID: 19054640
-
Assessment of tumor vascularization with functional computed tomography perfusion imaging in patients with cirrhotic liver disease.Hepatobiliary Pancreat Dis Int. 2011 Feb;10(1):43-9. doi: 10.1016/s1499-3872(11)60006-4. Hepatobiliary Pancreat Dis Int. 2011. PMID: 21269934
-
Advanced hepatocellular carcinoma: CT perfusion of liver and tumor tissue--initial experience.Radiology. 2007 Jun;243(3):736-43. doi: 10.1148/radiol.2433052020. Radiology. 2007. PMID: 17517931
-
Quantification of variability in breath-hold perfusion CT of hepatocellular carcinoma: a step toward clinical use.Radiology. 2012 Nov;265(2):448-56. doi: 10.1148/radiol.12111232. Epub 2012 Sep 20. Radiology. 2012. PMID: 22996748
-
Multidetector row CT and MR imaging in diagnosing hepatocellular carcinoma.Intervirology. 2004;47(3-5):209-26. doi: 10.1159/000078474. Intervirology. 2004. PMID: 15383731 Review.
Cited by
-
Comparison of various liver cancer staging systems in predicting prognosis after initial transcatheter arterial chemoembolization: a retrospective study from China.J Gastrointest Oncol. 2024 Dec 31;15(6):2599-2612. doi: 10.21037/jgo-2024-850. Epub 2024 Dec 27. J Gastrointest Oncol. 2024. PMID: 39816009 Free PMC article.
-
Evaluation of prognostic models to improve prediction of metastasis in patients following potentially curative treatment for primary colorectal cancer: the PROSPECT trial.Health Technol Assess. 2025 Apr;29(8):1-91. doi: 10.3310/BTMT7049. Health Technol Assess. 2025. PMID: 40230305 Free PMC article.
-
Effect of scan duration on CT perfusion values in metastases from renal cell carcinoma.Res Diagn Interv Imaging. 2023 Apr 10;6:100028. doi: 10.1016/j.redii.2023.100028. eCollection 2023 Jun. Res Diagn Interv Imaging. 2023. PMID: 39077545 Free PMC article.
-
Hepatocellular Carcinoma (HCC) Metastasis to the Diaphragm Muscle: A Systematic Review and Meta-Analysis of Case Reports.Cancers (Basel). 2024 Sep 4;16(17):3076. doi: 10.3390/cancers16173076. Cancers (Basel). 2024. PMID: 39272934 Free PMC article. Review.
-
Comparison of organ-specific-radiation dose levels between 70 kVp perfusion CT and standard tri-phasic liver CT in patients with hepatocellular carcinoma using a Monte-Carlo-Simulation-based analysis platform.Eur J Radiol Open. 2016 May 7;3:95-9. doi: 10.1016/j.ejro.2016.04.003. eCollection 2016. Eur J Radiol Open. 2016. PMID: 27200404 Free PMC article.
References
-
- Okuda K. Hepatocellular carcinoma: clinicopathological aspects. J Gastroenterol Hepatol. 1997;12:314–318. - PubMed
-
- Choi BY, Nguyen MH. The diagnosis and management of benign hepatic tumors. J Clin Gastroenterol. 2005;39:401–412. - PubMed
-
- Bruix J, Sherman M. Management of hepatocellular carcinoma. Hepatology. 2005;42:1208–1236. - PubMed
-
- Choi BI, Han JK, Cho JM, et al. Characterization of focal hepatic tumors. Cancer. 1995;76:2433–2442. - PubMed
-
- Passe TJ, Bluemke DA, Siegelman SS. Tumor angiogenesis: tutorial on implications for imaging. Radiology. 1997;203:593–600. - PubMed
MeSH terms
LinkOut - more resources
Full Text Sources
Other Literature Sources
Medical
Miscellaneous
