

Single-fluorophore biosensors based on conformation-sensitive GFP variants
- PMID: 24334549
- PMCID: PMC3929668
- DOI: 10.1096/fj.13-240507
Single-fluorophore biosensors based on conformation-sensitive GFP variants
Abstract
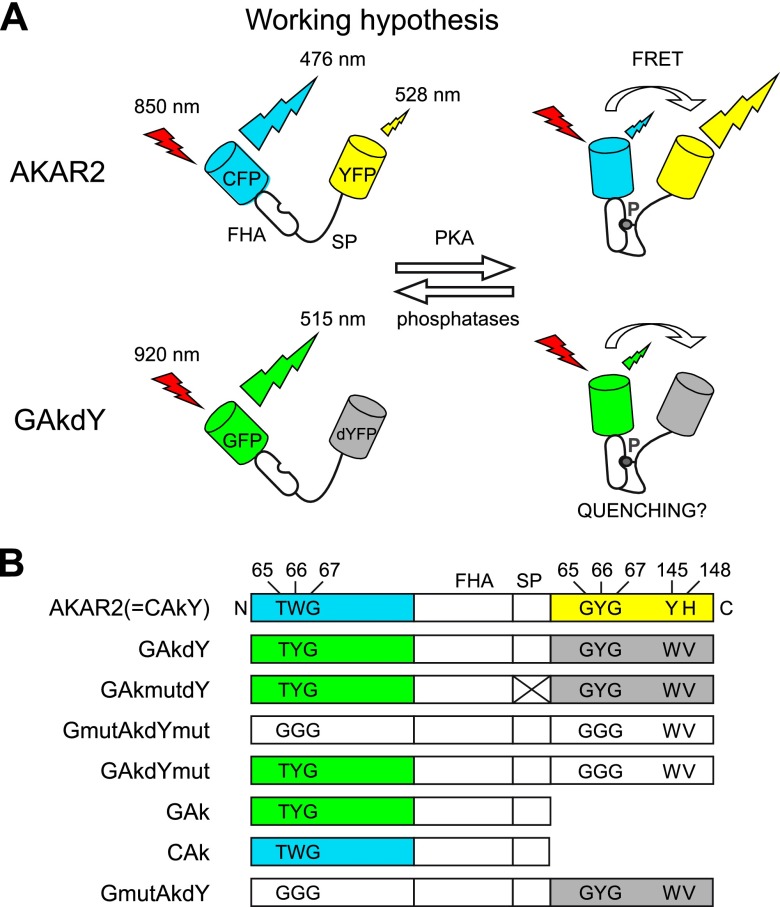
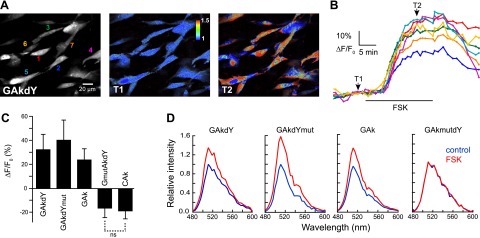
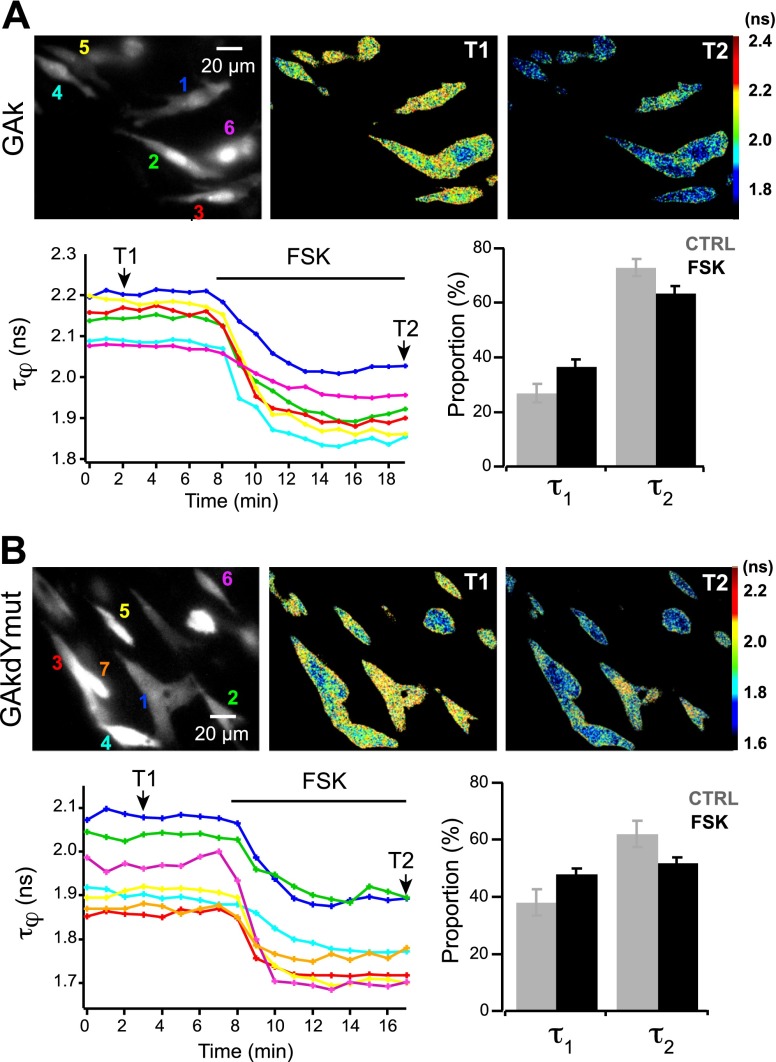
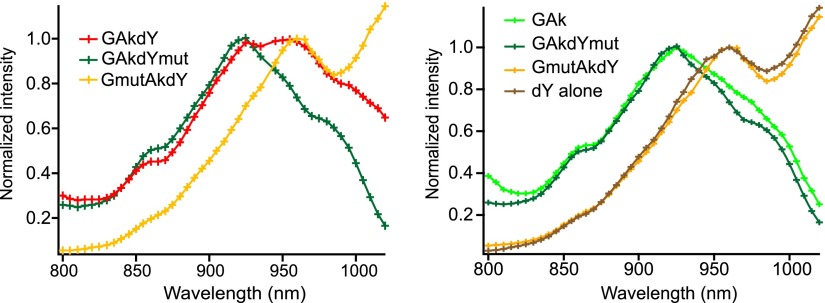
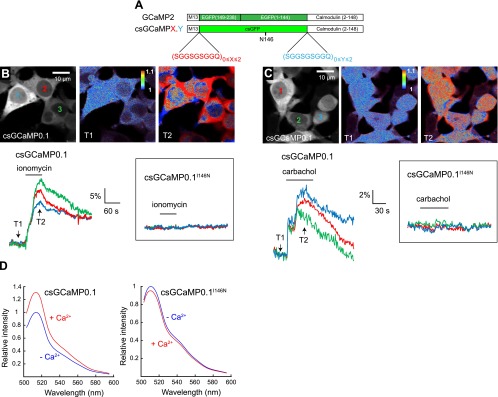
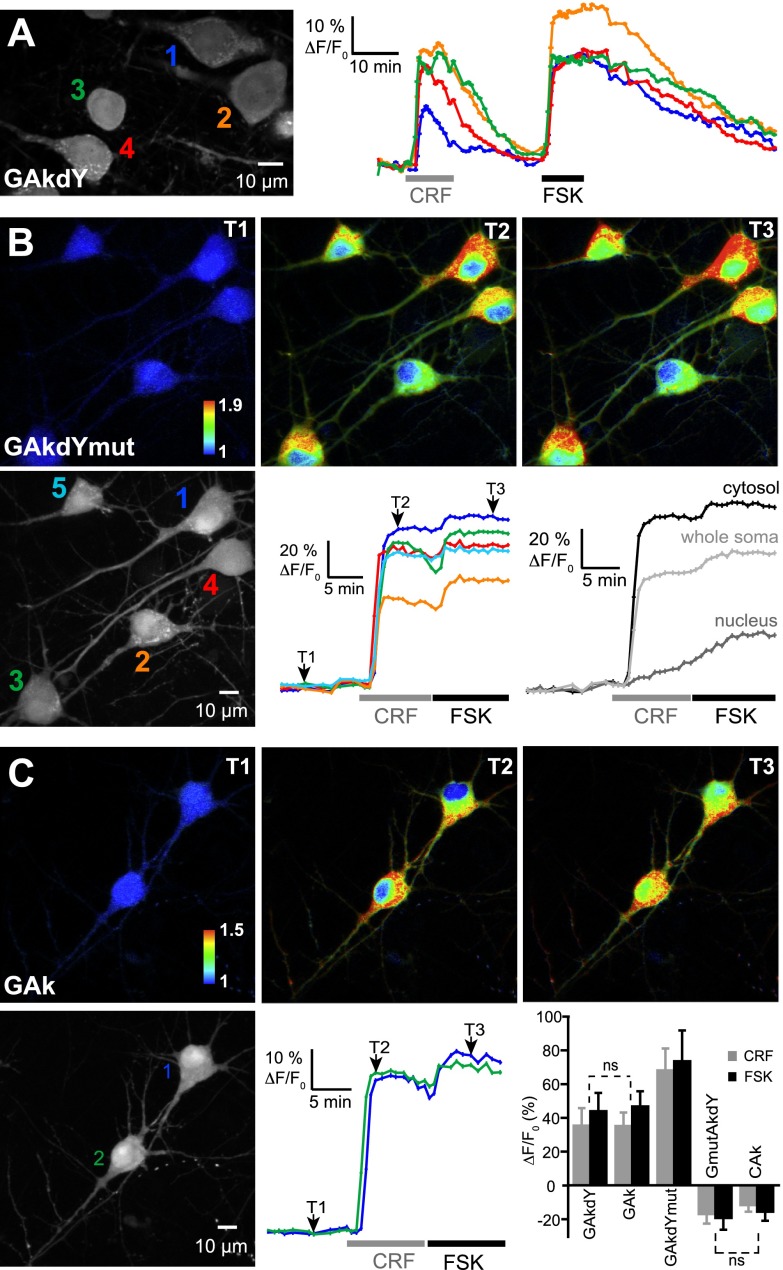
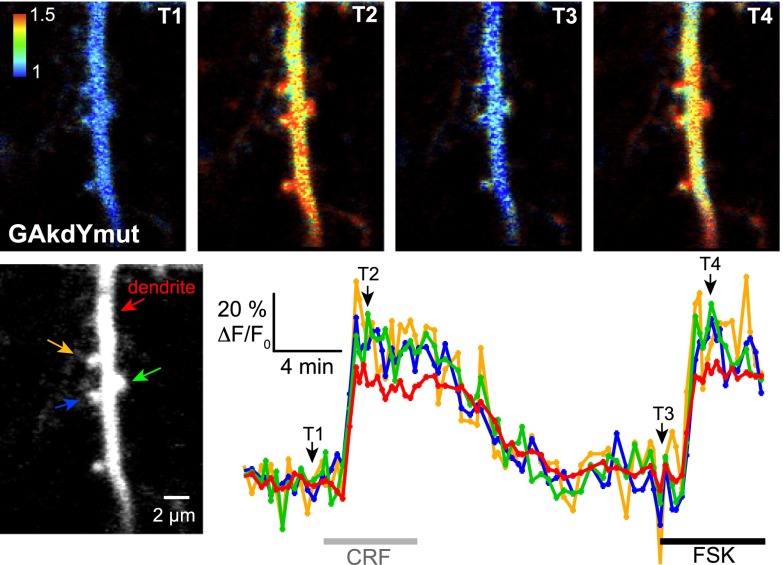
The β-strands of GFP form a rigid barrel that protects the chromophore from external influence. Herein, we identified specific mutations in β-strand 7 that render the chromophore sensitive to interactions of GFP with another protein domain. In the process of converting the FRET-based protein kinase A (PKA) sensor AKAR2 into a single-wavelength PKA sensor containing a GFP and a quencher, we discovered that the quencher was not required and that the sensor response relied on changes in GFP intrinsic fluorescence. The identified mutations in β-strand 7 render GFP fluorescence intensity and lifetime sensitive to conformational changes of the PKA-sensing domain. In addition, sensors engineered from the GCaMP2 calcium indicator to incorporate a conformation-sensitive GFP (csGFP) exhibited calcium-dependent fluorescence changes. We further demonstrate that single GFP sensors report PKA dynamics in dendritic spines of neurons from brain slices on 2-photon imaging with a high signal-to-baseline ratio and minimal photobleaching. The susceptibility of GFP variants to dynamic interactions with other protein domains provides a new approach to generate single wavelength biosensors for high-resolution imaging.
Keywords: chromophore; fluorescence lifetime imaging; genetically encoded indicators; green fluorescent protein; high-resolution microscopy; intracellular second messengers.
Figures
Similar articles
-
Booster, a Red-Shifted Genetically Encoded Förster Resonance Energy Transfer (FRET) Biosensor Compatible with Cyan Fluorescent Protein/Yellow Fluorescent Protein-Based FRET Biosensors and Blue Light-Responsive Optogenetic Tools.ACS Sens. 2020 Mar 27;5(3):719-730. doi: 10.1021/acssensors.9b01941. Epub 2020 Feb 26. ACS Sens. 2020. PMID: 32101394
-
Excited-state structural dynamics of a dual-emission calmodulin-green fluorescent protein sensor for calcium ion imaging.Proc Natl Acad Sci U S A. 2014 Jul 15;111(28):10191-6. doi: 10.1073/pnas.1403712111. Epub 2014 Jul 1. Proc Natl Acad Sci U S A. 2014. PMID: 24987121 Free PMC article.
-
Principles and applications of green fluorescent protein-based biosensors: a mini-review.Analyst. 2023 Jun 26;148(13):2882-2891. doi: 10.1039/d3an00320e. Analyst. 2023. PMID: 37255369 Review.
-
Imaging calcium responses in GFP-tagged neurons of hypothalamic mouse brain slices.J Vis Exp. 2012 Aug 24;(66):e4213. doi: 10.3791/4213. J Vis Exp. 2012. PMID: 22951467 Free PMC article.
-
Genetically Encoded Biosensors for the Fluorescence Detection of O2 and Reactive O2 Species.Sensors (Basel). 2023 Oct 17;23(20):8517. doi: 10.3390/s23208517. Sensors (Basel). 2023. PMID: 37896609 Free PMC article. Review.
Cited by
-
Genetically encoded sensors towards imaging cAMP and PKA activity in vivo.J Neurosci Methods. 2021 Oct 1;362:109298. doi: 10.1016/j.jneumeth.2021.109298. Epub 2021 Jul 31. J Neurosci Methods. 2021. PMID: 34339753 Free PMC article. Review.
-
Noradrenalin and dopamine receptors both control cAMP-PKA signaling throughout the cerebral cortex.Front Cell Neurosci. 2014 Aug 21;8:247. doi: 10.3389/fncel.2014.00247. eCollection 2014. Front Cell Neurosci. 2014. PMID: 25191229 Free PMC article.
-
Genetically-encoded tools for cAMP probing and modulation in living systems.Front Pharmacol. 2015 Sep 15;6:196. doi: 10.3389/fphar.2015.00196. eCollection 2015. Front Pharmacol. 2015. PMID: 26441653 Free PMC article. Review.
-
Structural characterization of green fluorescent protein in the I-state.Sci Rep. 2024 Oct 1;14(1):22832. doi: 10.1038/s41598-024-73696-y. Sci Rep. 2024. PMID: 39353998 Free PMC article.
-
Active Dentate Granule Cells Encode Experience to Promote the Addition of Adult-Born Hippocampal Neurons.J Neurosci. 2017 May 3;37(18):4661-4678. doi: 10.1523/JNEUROSCI.3417-16.2017. Epub 2017 Apr 3. J Neurosci. 2017. PMID: 28373391 Free PMC article.
References
-
- Tsien R. Y. (1998) The green fluorescent protein. Annu. Rev. Biochem. 67, 509–544 - PubMed
-
- Heim R., Tsien R. Y. (1996) Engineering green fluorescent protein for improved brightness, longer wavelengths and fluorescence resonance energy transfer. Curr. Biol. 6, 178–182 - PubMed
-
- Ormo M., Cubitt A. B., Kallio K., Gross L. A., Tsien R. Y., Remington S. J. (1996) Crystal structure of the Aequorea victoria green fluorescent protein. Science 273, 1392–1395 - PubMed
-
- VanEngelenburg S. B., Palmer A. E. (2008) Fluorescent biosensors of protein function. Curr. Opin. Chem. Biol. 12, 60–65 - PubMed
Publication types
MeSH terms
Substances
LinkOut - more resources
Full Text Sources
Other Literature Sources
