

Metagenomic frameworks for monitoring antibiotic resistance in aquatic environments
- PMID: 24334622
- PMCID: PMC3948035
- DOI: 10.1289/ehp.1307009
Metagenomic frameworks for monitoring antibiotic resistance in aquatic environments
Abstract
Background: High-throughput genomic technologies offer new approaches for environmental health monitoring, including metagenomic surveillance of antibiotic resistance determinants (ARDs). Although natural environments serve as reservoirs for antibiotic resistance genes that can be transferred to pathogenic and human commensal bacteria, monitoring of these determinants has been infrequent and incomplete. Furthermore, surveillance efforts have not been integrated into public health decision making.
Objectives: We used a metagenomic epidemiology-based approach to develop an ARD index that quantifies antibiotic resistance potential, and we analyzed this index for common modal patterns across environmental samples. We also explored how metagenomic data such as this index could be conceptually framed within an early risk management context.
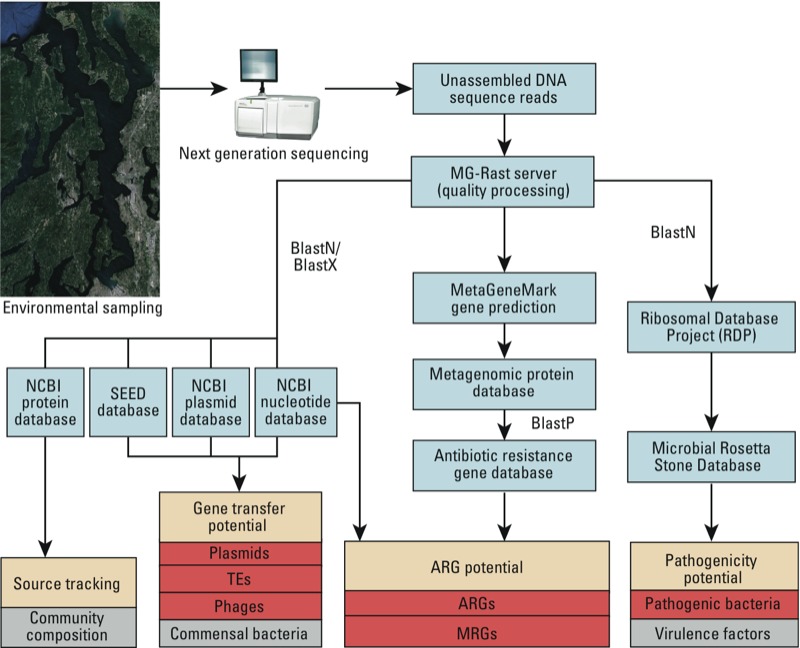
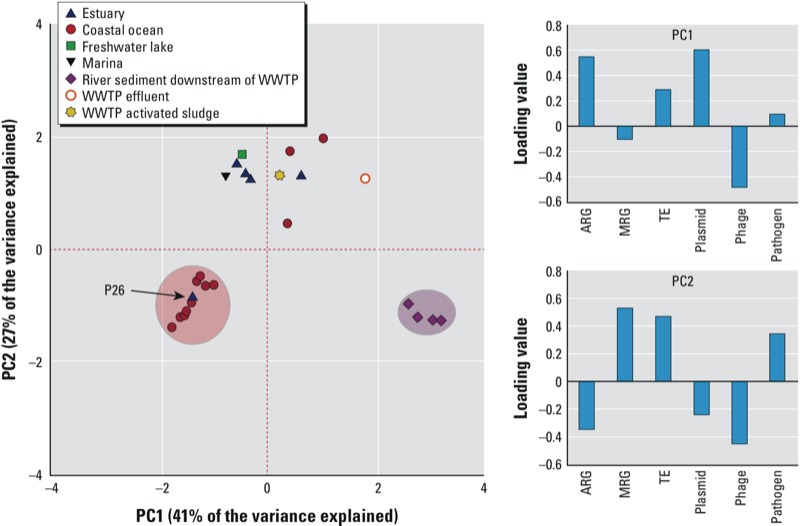
Methods: We analyzed 25 published data sets from shotgun pyrosequencing projects. The samples consisted of microbial community DNA collected from marine and freshwater environments across a gradient of human impact. We used principal component analysis to identify index patterns across samples.
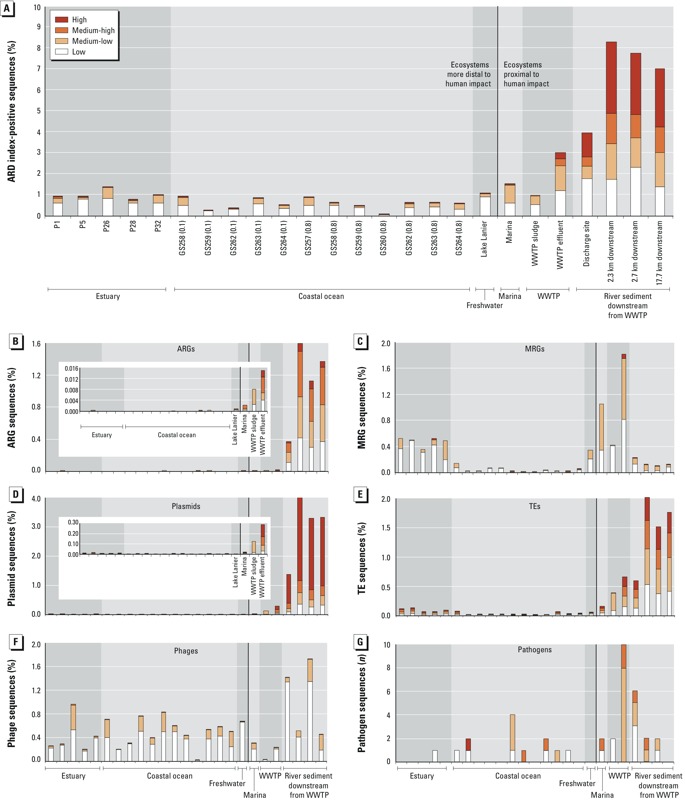
Results: We observed significant differences in the overall index and index subcategory levels when comparing ecosystems more proximal versus distal to human impact. The selection of different sequence similarity thresholds strongly influenced the index measurements. Unique index subcategory modes distinguished the different metagenomes.
Conclusions: Broad-scale screening of ARD potential using this index revealed utility for framing environmental health monitoring and surveillance. This approach holds promise as a screening tool for establishing baseline ARD levels that can be used to inform and prioritize decision making regarding management of ARD sources and human exposure routes.
Citation: Port JA, Cullen AC, Wallace JC, Smith MN, Faustman EM. 2014. Metagenomic frameworks for monitoring antibiotic resistance in aquatic environments. Environ Health Perspect 122:222–228; http://dx.doi.org/10.1289/ehp.1307009
Conflict of interest statement
The authors declare they have no actual or potential competing financial interests.
Figures
Similar articles
-
Variability in metagenomic samples from the Puget Sound: Relationship to temporal and anthropogenic impacts.PLoS One. 2018 Feb 13;13(2):e0192412. doi: 10.1371/journal.pone.0192412. eCollection 2018. PLoS One. 2018. PMID: 29438385 Free PMC article.
-
Metagenomic profiling of microbial composition and antibiotic resistance determinants in Puget Sound.PLoS One. 2012;7(10):e48000. doi: 10.1371/journal.pone.0048000. Epub 2012 Oct 29. PLoS One. 2012. PMID: 23144718 Free PMC article.
-
Distribution and quantification of antibiotic resistant genes and bacteria across agricultural and non-agricultural metagenomes.PLoS One. 2012;7(11):e48325. doi: 10.1371/journal.pone.0048325. Epub 2012 Nov 2. PLoS One. 2012. PMID: 23133629 Free PMC article.
-
Genomic and Metagenomic Approaches for Predictive Surveillance of Emerging Pathogens and Antibiotic Resistance.Clin Pharmacol Ther. 2019 Sep;106(3):512-524. doi: 10.1002/cpt.1535. Epub 2019 Jul 22. Clin Pharmacol Ther. 2019. PMID: 31172511 Free PMC article. Review.
-
Platforms for elucidating antibiotic resistance in single genomes and complex metagenomes.Environ Int. 2020 May;138:105667. doi: 10.1016/j.envint.2020.105667. Epub 2020 Mar 29. Environ Int. 2020. PMID: 32234679 Review.
Cited by
-
A Delphi Technology Foresight Study: Mapping Social Construction of Scientific Evidence on Metagenomics Tests for Water Safety.PLoS One. 2015 Jun 11;10(6):e0129706. doi: 10.1371/journal.pone.0129706. eCollection 2015. PLoS One. 2015. PMID: 26066837 Free PMC article.
-
Estuarine Aquacultures at the Crossroads of Animal Production and Antibacterial Resistance: A Metagenomic Approach to the Resistome.Biology (Basel). 2022 Nov 21;11(11):1681. doi: 10.3390/biology11111681. Biology (Basel). 2022. PMID: 36421395 Free PMC article.
-
Characterization of the Microbial Resistome in Conventional and "Raised Without Antibiotics" Beef and Dairy Production Systems.Front Microbiol. 2019 Sep 4;10:1980. doi: 10.3389/fmicb.2019.01980. eCollection 2019. Front Microbiol. 2019. PMID: 31555225 Free PMC article.
-
Unbiased Strain-Typing of Arbovirus Directly from Mosquitoes Using Nanopore Sequencing: A Field-forward Biosurveillance Protocol.Sci Rep. 2018 Apr 3;8(1):5417. doi: 10.1038/s41598-018-23641-7. Sci Rep. 2018. PMID: 29615665 Free PMC article.
-
Abundance and Distribution of Enteric Bacteria and Viruses in Coastal and Estuarine Sediments-a Review.Front Microbiol. 2016 Nov 1;7:1692. doi: 10.3389/fmicb.2016.01692. eCollection 2016. Front Microbiol. 2016. PMID: 27847499 Free PMC article. Review.
References
-
- Allen HK, Donato J, Wang HH, Cloud-Hansen KA, Davies J, Handelsman J. Call of the wild: antibiotic resistance genes in natural environments. Nat Rev Microbiol. 2010;8:251–259. - PubMed
-
- Altschul SF, Gish W, Miller W, Myers EW, Lipman DJ. Basic local alignment search tool. J Mol Biol. 1990;215:403–410. - PubMed
-
- Baquero F. Metagenomic epidemiology: a public health need for the control of antimicrobial resistance. Clin Microbiol Infect. 2012;18(suppl 4):67–73. - PubMed
Publication types
MeSH terms
Substances
Grants and funding
LinkOut - more resources
Full Text Sources
Other Literature Sources
Medical
