Large-scale prospective T cell function assays in shipped, unfrozen blood samples: experiences from the multicenter TRIGR trial
- PMID: 24334687
- PMCID: PMC3910927
- DOI: 10.1128/CVI.00516-13
Large-scale prospective T cell function assays in shipped, unfrozen blood samples: experiences from the multicenter TRIGR trial
Abstract
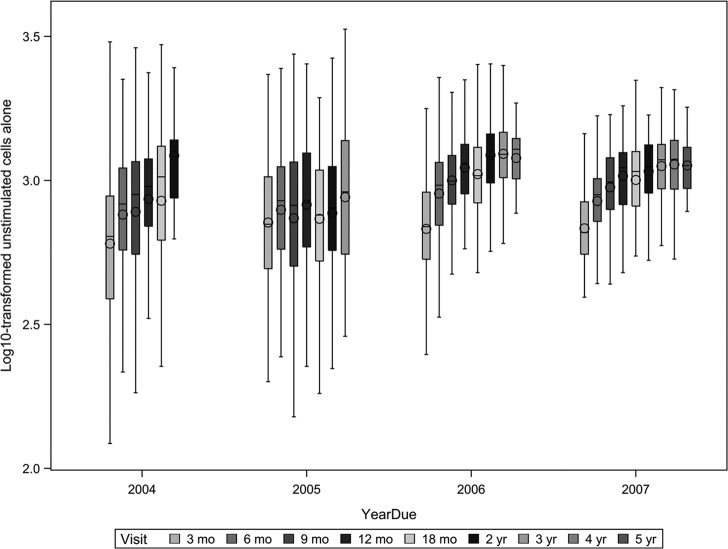
Broad consensus assigns T lymphocytes fundamental roles in inflammatory, infectious, and autoimmune diseases. However, clinical investigations have lacked fully characterized and validated procedures, equivalent to those of widely practiced biochemical tests with established clinical roles, for measuring core T cell functions. The Trial to Reduce Insulin-dependent diabetes mellitus in the Genetically at Risk (TRIGR) type 1 diabetes prevention trial used consecutive measurements of T cell proliferative responses in prospectively collected fresh heparinized blood samples shipped by courier within North America. In this article, we report on the quality control implications of this simple and pragmatic shipping practice and the interpretation of positive- and negative-control analytes in our assay. We used polyclonal and postvaccination responses in 4,919 samples to analyze the development of T cell immunocompetence. We have found that the vast majority of the samples were viable up to 3 days from the blood draw, yet meaningful responses were found in a proportion of those with longer travel times. Furthermore, the shipping time of uncooled samples significantly decreased both the viabilities of the samples and the unstimulated cell counts in the viable samples. Also, subject age was significantly associated with the number of unstimulated cells and T cell proliferation to positive activators. Finally, we observed a pattern of statistically significant increases in T cell responses to tetanus toxin around the timing of infant vaccinations. This assay platform and shipping protocol satisfy the criteria for robust and reproducible long-term measurements of human T cell function, comparable to those of established blood biochemical tests. We present a stable technology for prospective disease-relevant T cell analysis in immunological diseases, vaccination medicine, and measurement of herd immunity.
Figures


References
-
- Herold KC, Brooks-Worrell B, Palmer J, Dosch HM, Peakman M, Gottlieb P, Reijonen H, Arif S, Spain LM, Thompson C, Lachin JM. 2009. Validity and reproducibility of measurement of islet autoreactivity by T-cell assays in subjects with early type 1 diabetes. Diabetes 58:2588–2595. 10.2337/db09-0249 - DOI - PMC - PubMed
-
- Seyfert-Margolis V, Gisler TD, Asare AL, Wang RS, Dosch HM, Brooks-Worrell B, Eisenbarth GS, Palmer JP, Greenbaum CJ, Gitelman SE, Nepom GT, Bluestone JA, Herold KC. 2006. Analysis of T-cell assays to measure autoimmune responses in subjects with type 1 diabetes: results of a blinded controlled study. Diabetes 55:2588–2594. 10.2337/db05-1378 - DOI - PubMed
-
- Winer S, Astsaturov I, Cheung R, Gunaratnam L, Kubiak V, Cortez MA, Moscarello M, O'Connor PW, McKerlie C, Becker DJ, Dosch HM. 2001. Type I diabetes and multiple sclerosis patients target islet plus central nervous system autoantigens; nonimmunized nonobese diabetic mice can develop autoimmune encephalitis. J. Immunol. 166:2831–2841 - PubMed
Publication types
MeSH terms
Grants and funding
LinkOut - more resources
Full Text Sources
Other Literature Sources
Medical