

Down-regulation of placental mTOR, insulin/IGF-I signaling, and nutrient transporters in response to maternal nutrient restriction in the baboon
- PMID: 24334703
- PMCID: PMC3929672
- DOI: 10.1096/fj.13-242271
Down-regulation of placental mTOR, insulin/IGF-I signaling, and nutrient transporters in response to maternal nutrient restriction in the baboon
Abstract
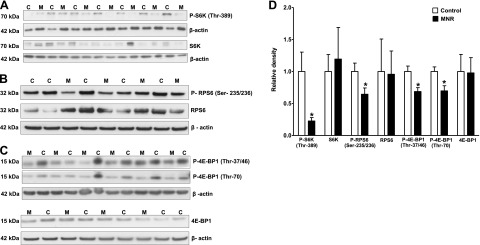
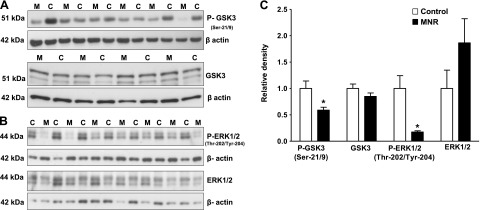
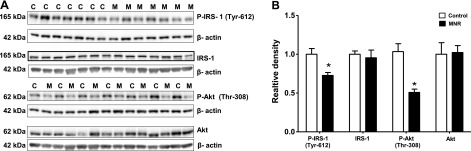
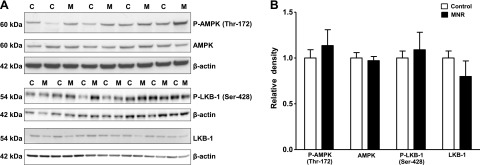
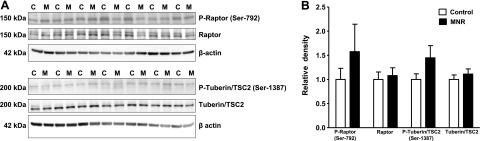
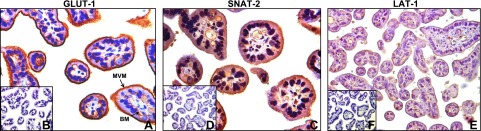
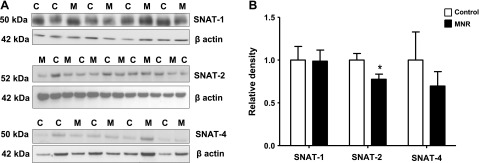
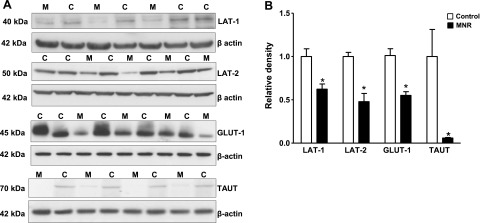
The mechanisms by which maternal nutrient restriction (MNR) causes reduced fetal growth are poorly understood. We hypothesized that MNR inhibits placental mechanistic target of rapamycin (mTOR) and insulin/IGF-I signaling, down-regulates placental nutrient transporters, and decreases fetal amino acid levels. Pregnant baboons were fed control (ad libitum, n=11) or an MNR diet (70% of controls, n=11) from gestational day (GD) 30. Placenta and umbilical blood were collected at GD 165. Western blot was used to determine the phosphorylation of proteins in the mTOR, insulin/IGF-I, ERK1/2, and GSK-3 signaling pathways in placental homogenates and expression of glucose transporter 1 (GLUT-1), taurine transporter (TAUT), sodium-dependent neutral amino acid transporter (SNAT), and large neutral amino acid transporter (LAT) isoforms in syncytiotrophoblast microvillous membranes (MVMs). MNR reduced fetal weights by 13%, lowered fetal plasma concentrations of essential amino acids, and decreased the phosphorylation of placental S6K, S6 ribosomal protein, 4E-BP1, IRS-1, Akt, ERK-1/2, and GSK-3. MVM protein expression of GLUT-1, TAUT, SNAT-2 and LAT-1/2 was reduced in MNR. This is the first study in primates exploring placental responses to maternal undernutrition. Inhibition of placental mTOR and insulin/IGF-I signaling resulting in down-regulation of placental nutrient transporters may link maternal undernutrition to restricted fetal growth.
Keywords: fetal growth restriction; nonhuman primate; trophoblast.
Figures
Similar articles
-
Reduced placental amino acid transport in response to maternal nutrient restriction in the baboon.Am J Physiol Regul Integr Comp Physiol. 2015 Oct;309(7):R740-6. doi: 10.1152/ajpregu.00161.2015. Epub 2015 Aug 5. Am J Physiol Regul Integr Comp Physiol. 2015. PMID: 26246504 Free PMC article.
-
Maternal protein restriction in the rat inhibits placental insulin, mTOR, and STAT3 signaling and down-regulates placental amino acid transporters.Endocrinology. 2011 Mar;152(3):1119-29. doi: 10.1210/en.2010-1153. Epub 2011 Feb 1. Endocrinology. 2011. PMID: 21285325 Free PMC article.
-
Down-Regulation of Placental Transport of Amino Acids Precedes the Development of Intrauterine Growth Restriction in Maternal Nutrient Restricted Baboons.Biol Reprod. 2016 Nov;95(5):98. doi: 10.1095/biolreprod.116.141085. Epub 2016 Sep 7. Biol Reprod. 2016. PMID: 27605346 Free PMC article.
-
The emerging role of mTORC1 signaling in placental nutrient-sensing.Placenta. 2012 Nov;33 Suppl 2(Suppl 2):e23-9. doi: 10.1016/j.placenta.2012.05.010. Epub 2012 Jun 10. Placenta. 2012. PMID: 22687819 Free PMC article. Review.
-
Novel roles of mechanistic target of rapamycin signaling in regulating fetal growth†.Biol Reprod. 2019 Apr 1;100(4):872-884. doi: 10.1093/biolre/ioy249. Biol Reprod. 2019. PMID: 30476008 Free PMC article. Review.
Cited by
-
Maternal nutrition modifies trophoblast giant cell phenotype and fetal growth in mice.Reproduction. 2015 Jun;149(6):563-75. doi: 10.1530/REP-14-0667. Epub 2015 Mar 9. Reproduction. 2015. PMID: 25755287 Free PMC article.
-
Trophoblast-specific overexpression of adiponectin receptor 2 causes fetal growth restriction in pregnant mice.FASEB J. 2024 Oct 15;38(19):e70100. doi: 10.1096/fj.202302143R. FASEB J. 2024. PMID: 39387608
-
Reduced Na+ K+ -ATPase activity may reduce amino acid uptake in intrauterine growth restricted fetal sheep muscle despite unchanged ex vivo amino acid transporter activity.J Physiol. 2020 Apr;598(8):1625-1639. doi: 10.1113/JP278933. Epub 2020 Feb 3. J Physiol. 2020. PMID: 31909825 Free PMC article.
-
Placental phenotype and the insulin-like growth factors: resource allocation to fetal growth.J Physiol. 2017 Aug 1;595(15):5057-5093. doi: 10.1113/JP273330. Epub 2017 May 23. J Physiol. 2017. PMID: 28337745 Free PMC article. Review.
-
Reduced placental amino acid transport in response to maternal nutrient restriction in the baboon.Am J Physiol Regul Integr Comp Physiol. 2015 Oct;309(7):R740-6. doi: 10.1152/ajpregu.00161.2015. Epub 2015 Aug 5. Am J Physiol Regul Integr Comp Physiol. 2015. PMID: 26246504 Free PMC article.
References
-
- Nord M., Coleman-Jensen A., Andrews M., Carlson S. (2010) Household food security in the United States, 2009. United States Department of Agriculture, Economic Research Services
-
- Brodsky D., Christou H. (2004) Current concepts in intrauterine growth restriction. J. Intensive Care Med. 19, 307–319 - PubMed
-
- Barker D. J., Gluckman P. D., Godfrey K. M., Harding J. E., Owens J. A., Robinson J. S. (1993) Fetal nutrition and cardiovascular disease in adult life. Lancet 341, 938–941 - PubMed
Publication types
MeSH terms
Substances
Grants and funding
LinkOut - more resources
Full Text Sources
Other Literature Sources
Medical
Research Materials
Miscellaneous
