. 2015 May;25(5):1389-404.
doi: 10.1093/cercor/bht335. Epub 2013 Dec 11.

Development of human brain structural networks through infancy and childhood

Affiliations

Development of human brain structural networks through infancy and childhood

Hao Huang et al. Cereb Cortex. 2015 May.

Abstract

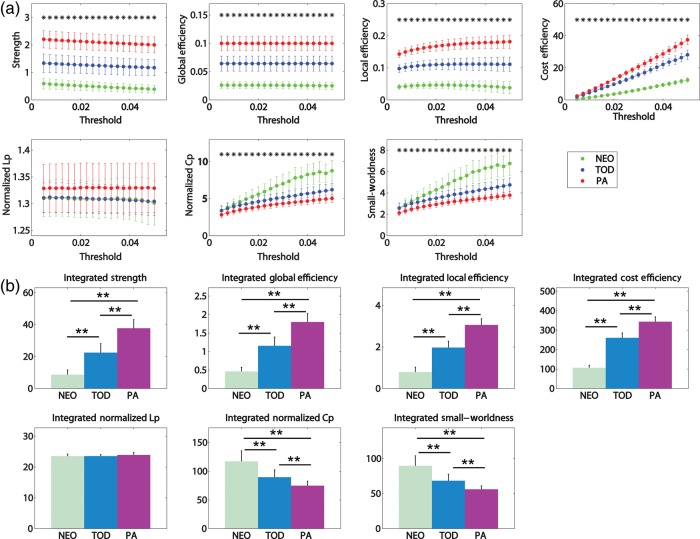
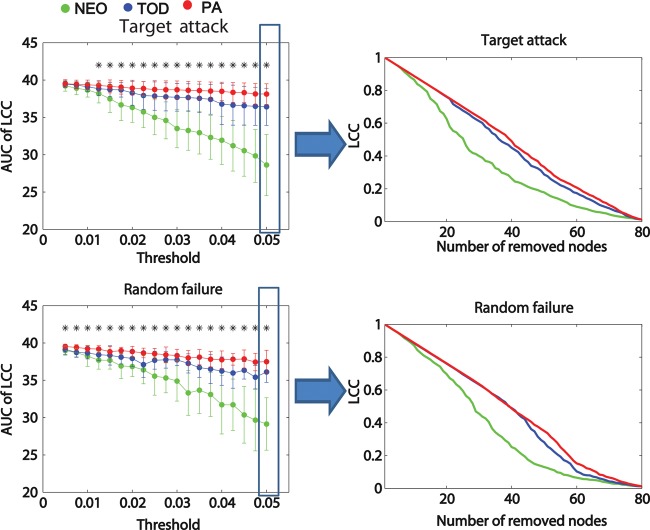
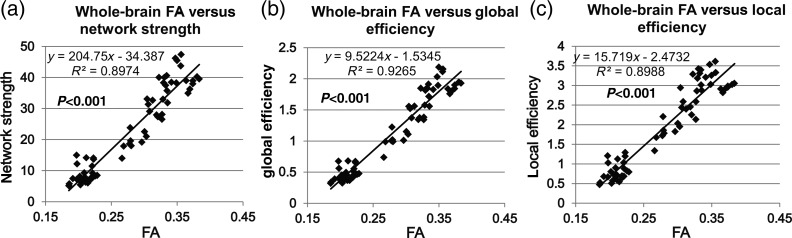
During human brain development through infancy and childhood, microstructural and macrostructural changes take place to reshape the brain's structural networks and better adapt them to sophisticated functional and cognitive requirements. However, structural topological configuration of the human brain during this specific development period is not well understood. In this study, diffusion magnetic resonance image (dMRI) of 25 neonates, 13 toddlers, and 25 preadolescents were acquired to characterize network dynamics at these 3 landmark cross-sectional ages during early childhood. dMRI tractography was used to construct human brain structural networks, and the underlying topological properties were quantified by graph-theory approaches. Modular organization and small-world attributes are evident at birth with several important topological metrics increasing monotonically during development. Most significant increases of regional nodes occur in the posterior cingulate cortex, which plays a pivotal role in the functional default mode network. Positive correlations exist between nodal efficiencies and fractional anisotropy of the white matter traced from these nodes, while correlation slopes vary among the brain regions. These results reveal substantial topological reorganization of human brain structural networks through infancy and childhood, which is likely to be the outcome of both heterogeneous strengthening of the major white matter tracts and pruning of other axonal fibers.

Keywords: brain development; connectome; fractional anisotropy; module; pruning.


Figures

Figure 1.
Figure 1.
Flow chart of generating the connectivity matrices for neonate, toddler, and preadolescent groups from DTI and structural MRI. Data from a typical neonate, toddler, and preadolescent brain were used to demonstrate the image analysis process. (a) shows the high-resolution DTI color-encoded map for the subject at each cross-sectional age and corresponding cortical parcellation. With each cortical node as region of interest to initialize DTI tractography, and (b) shows the probabilistic tractography of these subjects. With the information from both cortical parcellation in (a) and probabilistic tracking in (b) for node and weighted edge definition, respectively, the connectivity matrices were built up for these subjects as shown in (c). Preado is the abbreviation of preadolescent.
Figure 2.
Figure 2.
(a) The averaged structural connectivity matrix of neonate, toddler, and preadolescent group; (b) 3D representations (lateral view) of the mean WM structural networks of each group. The nodes are located according to their centroid stereotaxic coordinates, and the edges are encoded with their connection weights, which were thresholded with 0.05. The networks were visualized by the BrainNet Viewer (www.nitrc.org/projects/bnv/) (Xia et al. 2013). For details, see the Materials and Methods section. NEO, TOD, and PA in (c) are the abbreviations of neonates, toddlers, and preadolescents, respectively.
Figure 3.
Figure 3.
(a) Group differences in global network measures among 3 groups under different thresholds. Asterisks: significant group differences with ANOVA at P < 0.05 (Bonferroni-corrected). (b) Group differences in integrated global network measures among 3 groups. **P < 0.01. The error bars indicate standard deviation.
Figure 4.
Figure 4.
(a) Group differences in the number of modules, the number of connectors, and modularity of the structural networks among 3 groups under different thresholds. Asterisks: significant group differences with ANOVA at P < 0.05 (Bonferroni-corrected). The error bars indicate standard deviation. (b) 3D representations (axial view) of the mean WM structural networks demonstrate network modules of each group. The nodes are colored-coded by the modules. The edges are encoded with their connection weights, which were thresholded with 0.05.
Figure 5.
Figure 5.
Distributions of hub regions in each group (ac) and regions with significantly increased (nodes in red) or decreased (nodes in blue) normalized efficiency (P < 0.01, FDR-corrected) during development (d). Normalized efficiency of right PCG and left HES, which represents the one with most increased and most decreased normalized efficiency, respectively, is shown in (d). The error bars in (d) indicate standard deviation.
Figure 6.
Figure 6.
Topological robustness of the structural networks in each group. The graphs show the AUC of the LCC as a function of the removed node number by targeted attacks (a) or random failures (b). To demonstrate the details, the graphs of relative size of LCC at threshold 0.05 as a function of the number of removed nodes are shown in the right panels. The brain networks in the preadolescents (red line) were approximately as robust as those in toddlers (blue line) in response to both target attacks and random failures. However, the neonates (green line) displayed remarkably reduced stability against both targeted attack and random failure when compared with the other 2 groups. Asterisks: significant group differences with ANOVA at P < 0.05 (Bonferroni-corrected). The error bars indicate standard deviation.
Figure 7.
Figure 7.
Relationship between whole-brain WM FA and network strength (a), whole-brain WM FA and global efficiency (b), and whole-brain FA and local efficiency (c).
Figure 8.
Figure 8.
Differences in absolute nodal efficiency and nodal FA of the 3 groups with the nodal size encoded by ANOVA F-values are shown in (a) and (b), respectively. The F-values encoding the ball sizes in (a) and (b) are also shown at the bottom of these panels. For all the nodes shown in (a) and (b), there are significant absolute nodal efficiency increase (P < 0.0001, FDR-corrected, in a) and FA increase (P < 0.0001, FDR-corrected, in b). The correlations of nodal efficiency of right PCG, left SMG, or whole-brain and corresponding WM FA for individual subjects of all the age groups are shown in (c). The linear fitting lines and square of Pearson's correlation coefficient are also displayed in (c).
Figure 9.
Figure 9.
Comparisons of connectivity matrix and edge weight distribution pattern (a), network metrics (b), and hub distribution (c) between preadolescents and adults. In (b), asterisks indicate significant group differences at P < 0.05 (Bonferroni-corrected); **P < 0.01. The error bars in (b) indicate standard deviation.

Similar articles

Cited by

References

    1. Achard S, Bullmore E. 2007. Efficiency and cost of economical brain functional networks. PLoS Comput Biol. 3:174–183. - PMC - PubMed
    1. Achard S, Salvador R, Whitcher B, Suckling J, Bullmore E. 2006. A resilient, low-frequency, small-world human brain functional network with highly connected association cortical hubs. J Neurosci. 26:63–72. - PMC - PubMed
    1. Albert R, Jeong H, Barabasi AL. 2000. Error and attack tolerance of complex networks. Nature. 406:378–382. - PubMed
    1. Alexander-Bloch A, Giedd JN, Bullmore E. 2013. Imaging structural co-variance between brain regions. Nat Rev Neurosci. 14:322–336. - PMC - PubMed
    1. Alexander-Bloch A, Raznahan A, Bullmore E, Giedd J. 2013. The convergence of maturational change and structural covariance in human cortical networks. J Neurosci. 33:2889–2899. - PMC - PubMed

Publication types