Review
. 2013 Dec 13;54(14):ORSF68-80.
doi: 10.1167/iovs.13-12757.

Dry age-related macular degeneration: mechanisms, therapeutic targets, and imaging

Affiliations
Review

Dry age-related macular degeneration: mechanisms, therapeutic targets, and imaging

Catherine Bowes Rickman et al. Invest Ophthalmol Vis Sci. .

Abstract

Age-related macular degeneration is the leading cause of irreversible visual dysfunction in individuals over 65 in Western Society. Patients with AMD are classified as having early stage disease (early AMD), in which visual function is affected, or late AMD (generally characterized as either "wet" neovascular AMD, "dry" atrophic AMD or both), in which central vision is severely compromised or lost. Until recently, there have been no therapies available to treat the disorder(s). Now, the most common wet form of late-stage AMD, choroidal neovascularization, generally responds to treatment with anti-vascular endothelial growth factor therapies. Nevertheless, there are no current therapies to restore lost vision in eyes with advanced atrophic AMD. Oral supplementation with the Age-Related Eye Disease Study (AREDS) or AREDS2 formulation (antioxidant vitamins C and E, lutein, zeaxanthin, and zinc) has been shown to reduce the risk of progression to advanced AMD, although the impact was in neovascular rather than atrophic AMD. Recent findings, however, have demonstrated several features of early AMD that are likely to be druggable targets for treatment. Studies have established that much of the genetic risk for AMD is associated with complement genes. Consequently, several complement-based therapeutic treatment approaches are being pursued. Potential treatment strategies against AMD deposit formation and protein and/or lipid deposition will be discussed, including anti-amyloid therapies. In addition, the role of autophagy in AMD and prevention of oxidative stress through modulation of the antioxidant system will be explored. Finally, the success of these new therapies in clinical trials and beyond relies on early detection, disease typing, and predicting disease progression, areas that are currently being rapidly transformed by improving imaging modalities and functional assays.

Keywords: autophagy; complement; drusen; functional imaging; therapeutic targets.


Figures
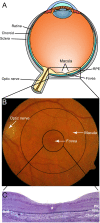
Figure 1
Figure 1
Ocular anatomy of a healthy eye relevant to AMD. (A) Cross-section schematic of a human eye showing major structures. (B) Color fundus photograph from an elderly patient covering the area indicated in (A) showing a healthy macula (dashed line, ø = ∼6 mm), healthy fovea (solid line, ø = ∼1.5–2 mm), and healthy optic nerve head (ø = ∼1.5–2 mm), respectively (photograph courtesy of Eleonora Lad). (C) Immunohistochemical cross-section of the foveal region indicated in (B), foveola (ø = 0.2–0.3 mm, indicated by *), which contains only cone photoreceptors and no rods, is located at the center of the foveal pit. Photoreceptor layer (PR), RPE, BrM, and choroid, are indicated (fovea image courtesy of Christine Curcio).
Figure 2
Figure 2
Fundus photography, FAF, and SD-OCT images of early (A, C, E) and late cases (B, D, F) of dry AMD. Fundus photographs of early AMD (A) and GA (B) are not easily differentiated. However, in FAF images (C, D) the difference is striking. In SD-OCT B-scan images the RPE and PR layers can be delineated in early stage dry AMD (E) while these layers are missing in the area of GA (arrow in [F]). Spectral-domain OCT scans were acquired from the location indicated by the green lines on the FAF images (images courtesy of Eleonora Lad).
Figure 3
Figure 3
Cone structures in a 61-year-old healthy subject (top panels) and a 64-year-old subject with dry AMD (bottom panels). The panels show (left to right) color fundus photos, infrared fundus photos with SD-OCT superimposed, color fundus photo with montage of AO-SLO images superimposed, AO-SLO image with a box highlighting a magnified AO-SLO image (far right panel). In the healthy subject, the far right panel shows red crosses where cones were quantified and cone spacing fell within normal limits for the eccentricity shown. In the AMD patient the red box includes a region over a druse, which can be seen on the SD-OCT. The highly magnified AO-SLO image shows coarse cones over the surface of the druse (arrow). Scale bars: 1° (figure courtesy of Jacque L. Duncan and her colleagues Katrina A. Woo, Shiri Zayit-Soudry, and Austin J. Roorda [Woo KA, et al. IOVS 2011;54:ARVO E-Abstract 1672]).
Figure 4
Figure 4
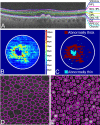
Application of novel automated segmentation algorithms for analysis of the anatomical and pathologic biomarkers of dry AMD. (A) Automated segmentation of the eight retinal boundaries on an SD-OCT image of a dry AMD patient with drusen using DOCTRAP software delineating the vitreous (at the top of the image) from the nerve fiber layer (NFL, blue line), NFL from ganglion cell layer and inner plexiform layer (GCL+IPL) complex (pink line), GCL+IPL from inner nuclear layer (INL, aqua line), INL from outer plexiform layer (OPL, yellow line), OPL from outer nuclear layer and inner segment (ONL+ IS) of the photoreceptor layer (green line), ONL+ IS from outer segments (OS) of the photoreceptor layer (blue line), OS from the RPE and drusen complex (RPE DC, pink line), and the RPE DC from the choroid (aqua line). The top and bottom boundaries correspond to the inner limiting membrane (ILM) and the Bruch membrane, respectively. (B) Example of a 5 mm in diameter RPE DC thickness map centered at the fovea from a dry AMD patient. Thickening around the fovea (red and yellow regions) is indicative of drusen, while thinning (blue regions) is representative of GA. (C) DOCTRAP software automatically extracts areas of abnormally thin (cyan region) and thick (red region) RPE DC from the thickness map in (B), which we use to automatically distinguish AMD from healthy eyes. (D) Automatically segmented confocal fluorescence image of the RPE cells in a flat-mounted APOE4 mouse retina. (E) Automatically segmented AO-SLO image of the cone photoreceptors in a healthy human subject.

Similar articles

Cited by

References

    1. Klein R, Klein BE, Jensen SC, Meuer SM. The five-year incidence and progression of age-related maculopathy: the Beaver Dam Eye Study. Ophthalmology. 1997; 104: 7–21 - PubMed
    1. Klein R, Cruickshanks KJ, Nash SD, et al. The prevalence of age-related macular degeneration and associated risk factors. Arch Ophthalmol. 2010; 128: 750–758 - PMC - PubMed
    1. Ferris FL III, Wilkinson CP, Bird A, et al. Clinical classification of age-related macular degeneration. Ophthalmology. 2013; 120: 844–851 - PMC - PubMed
    1. Bird AC. Therapeutic targets in age-related macular disease. J Clin Invest. 2010; 120: 3033–3041 - PMC - PubMed
    1. Klein R, Klein BE, Franke T. The relationship of cardiovascular disease and its risk factors to age-related maculopathy. The Beaver Dam Eye Study. Ophthalmology. 1993; 100: 406–414 - PubMed

Publication types

MeSH terms