. 2014 Feb;20(2):189-201.
doi: 10.1261/rna.042168.113. Epub 2013 Dec 11.

Tumor microenvironment-associated modifications of alternative splicing

Tumor microenvironment-associated modifications of alternative splicing

Jean-Philippe Brosseau et al. RNA. 2014 Feb.

Abstract

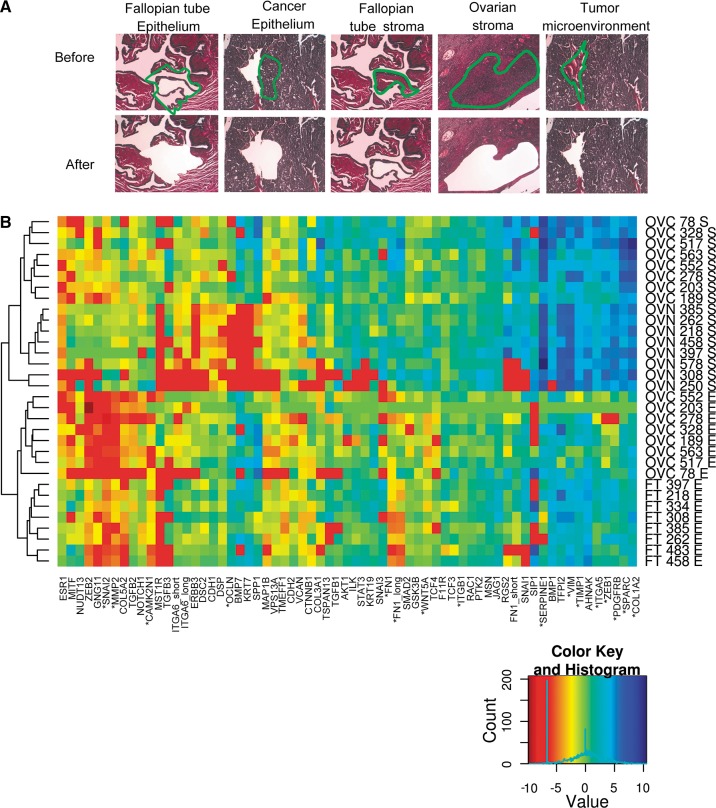
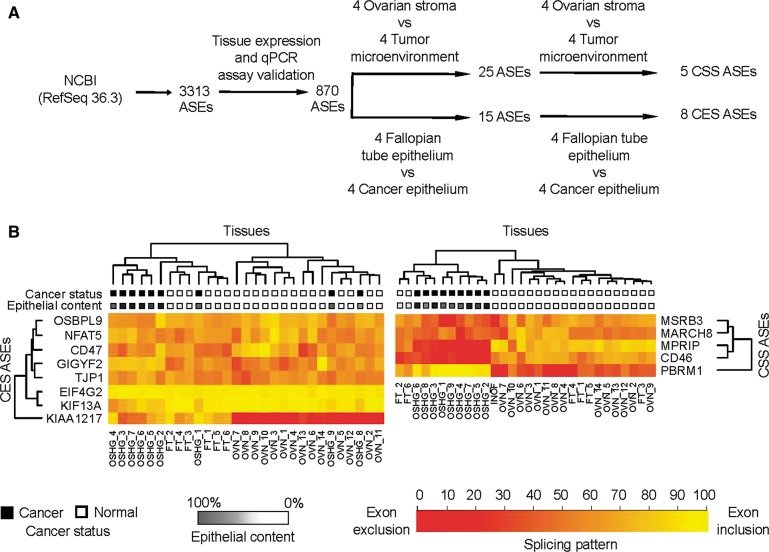
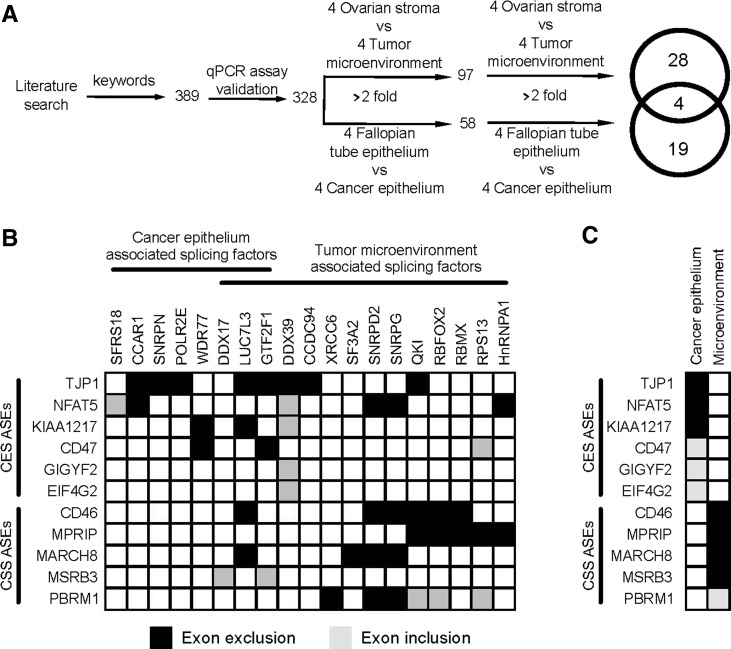
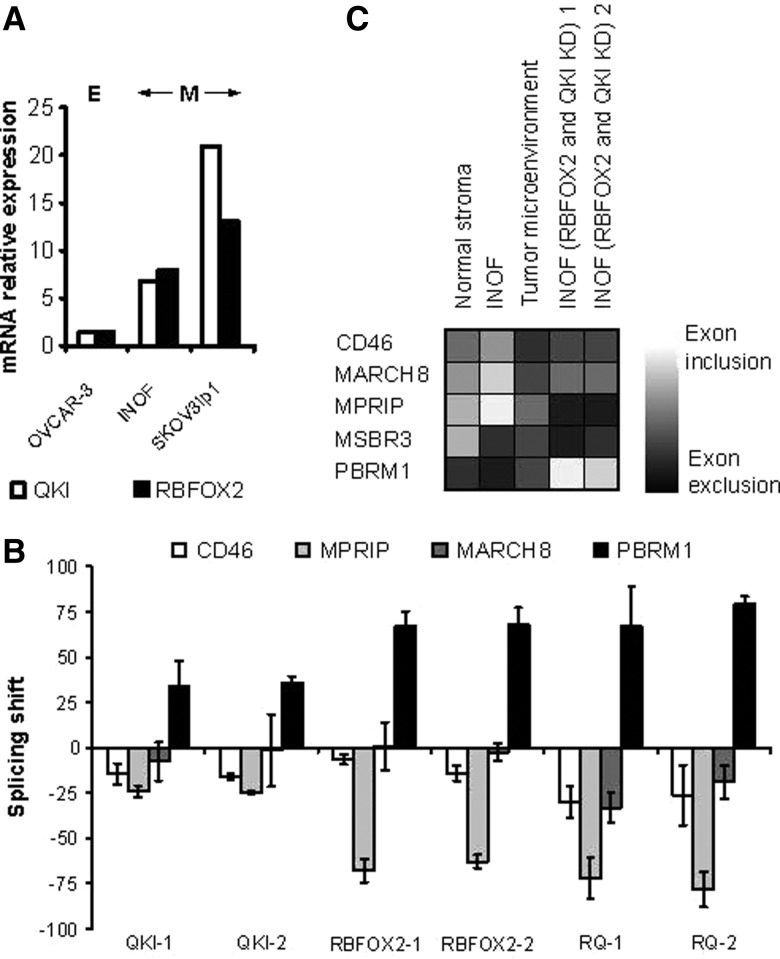
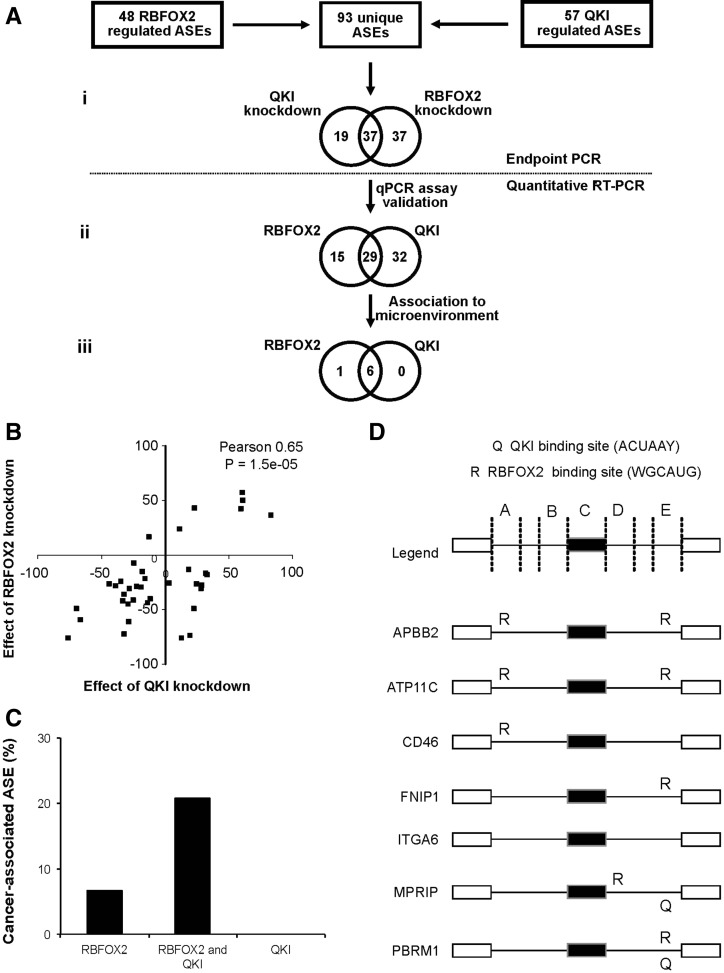
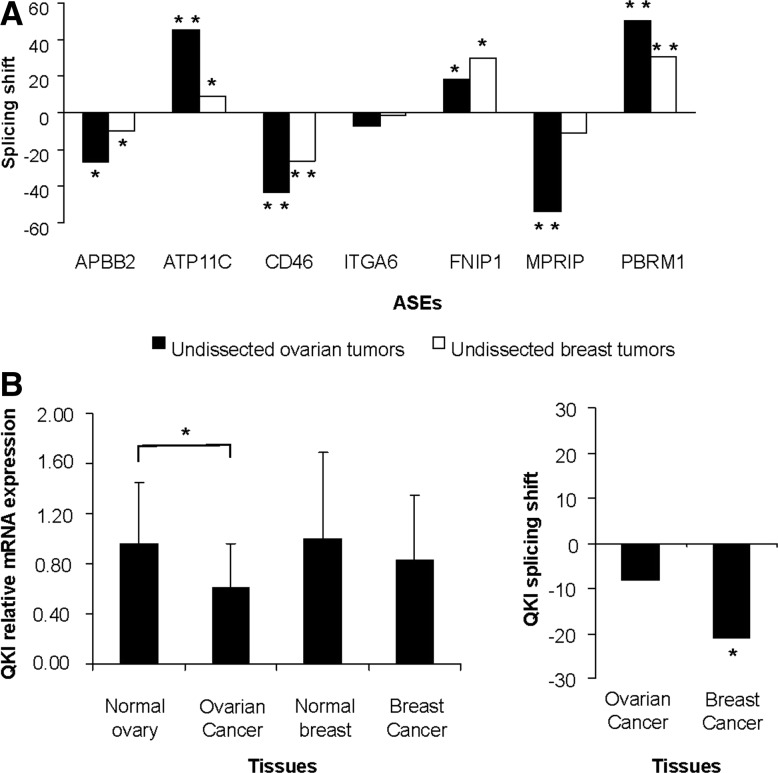
Pre-mRNA alternative splicing is modified in cancer, but the origin and specificity of these changes remain unclear. Here, we probed ovarian tumors to identify cancer-associated splicing isoforms and define the mechanism by which splicing is modified in cancer cells. Using high-throughput quantitative PCR, we monitored the expression of splice variants in laser-dissected tissues from ovarian tumors. Surprisingly, changes in alternative splicing were not limited to the tumor tissues but were also found in the tumor microenvironment. Changes in the tumor-associated splicing events were found to be regulated by splicing factors that are differentially expressed in cancer tissues. Overall, ∼20% of the alternative splicing events affected by the down-regulation of the splicing factors QKI and RBFOX2 were altered in the microenvironment of ovarian tumors. Together, our results indicate that the tumor microenvironment undergoes specific changes in alternative splicing orchestrated by a limited number of splicing factors.

Keywords: RNA binding proteins; alternative splicing; laser capture microdissection; ovarian cancer; tumor microenvironment.


Figures

FIGURE 1.
FIGURE 1.
Laser capture microdissection (LCM) of normal and cancer ovarian tissues. (A) Hematoxylin and eosin stain samples from Fallopian tubes, ovaries, and high-grade serous ovarian tumors visualized by light microscopy before and after dissection at 10× magnification. (Green) The limits of dissected tissues; (top) the type of tissues examined. Dissected tissues with similar cell population in both normal and cancer samples were chosen for RNA extraction. Typically, dissected Fallopian tube epithelium was composed of 90% epithelial and 10% fibroblast cells; dissected cancer epithelium was composed of >95% epithelial and <5% fibroblast and other nonepithelial cells (e.g., endothelial and inflammatory cells); dissected ovarian stroma and dissected tumor microenvironment were composed of 60%–80% fibroblast, 10%–20% endothelial, and 10%–20% inflammatory cells (for details, see Materials and Methods). (B) Quality of the dissected tissues. The expression of 65 stromal and epithelial markers was monitored in eight high-grade serous ovarian cancer, eight Fallopian tube epithelia, and eight normal ovarian stroma dissected samples. Relative values were normalized to housekeeping genes as previously described (Prinos et al. 2011). The results are displayed in the form of a heatmap representing the log-transformed gene expression value of epithelial and stromal markers (x-axis) in the different tissues (y-axis). Tissue samples were classified using unsupervised clustering of log-transformed gene expression values using Manhattan distance. (Left) The clustering dendrograms; (right) the type of tissues; (bottom right) the color code representing the gene expression. (Red) Low expression; (blue) high expression. (*) The most predictive markers (P < 0.0001, t-test). Detailed description (Supplemental Table S13) and individual expression values (Supplemental Table S1) of the dissected tissues are provided as Supplemental Material.
FIGURE 2.
FIGURE 2.
Identification of alternative splicing events associated with ovarian tumor and its microenvironment. (A) Strategy for the identification of cancer-specific alternative splicing patterns. Expression of the 3313 simple ASEs (i.e., cassette exons, alternative 5′ and 3′ splice sites, and intron retention) annotated in the RefSeq database 36.3 (Pruitt et al. 2007) was examined using endpoint PCR amplification of five RNA samples extracted from normal Fallopian tube tissue and ovarian cancer tissues (for details, see Materials and Methods; see raw data in http://palace.lgfus.ca/pcrreactiongroup/list/226). Validated quantitative RT-PCR assays were developed for a total of 870 expressed ASEs, and the resulting PCR values were used to calculate the mean quantitative splicing shift (Prinos et al. 2011) (ΔQψ = QψTUMORQψNORMAL) in the different normal and cancer tissues described in Figure 1 and Supplemental Table S13. ASEs were ranked based on a t-test of the mean quantitative splicing shift, and ASEs displaying statistically significant differences between normal and cancer tissues (P < 0.05, t-test) and a ΔQψ > 15 were reexamined in an independent set of dissected tissues (for details, see Materials and Methods). The final number of validated ASEs capable of discriminating between normal and cancer epithelium (CES) or stroma (CSS) is indicated. (B) Splicing markers detected in undissected cancer tissues and immortalized normal ovarian fibroblast (INOF) cell line. The quantitative percent splicing pattern (Qψ) (Prinos et al. 2011) of the CES and CSS ASEs was determined by quantitative RT-PCR in an independent set of undissected ovarian tissues containing nine high-grade serous ovarian cancers, six Fallopian tubes, and 14 normal ovarian tissues (Supplemental Table S14). In addition, we also monitored splicing in INOF as a pure source of normal ovarian fibroblast. The results are displayed in the form of two heatmaps representing the splicing patterns of the CES (left panel) and the CSS (right panel) in the different tissues. Gene names and the gene clusters are shown on the y-axis. The type of tissue—(OSHG) ovarian serous high grade, (OVN) normal ovary, (FT) Fallopian tube—is indicated at the bottom, and the tissue clusters are shown on top. (Black boxes) Cancer and (white boxes) normal tissues are indicated. (Grayscale) The epithelial content of tissues; (dark gray) high epithelial content; (light gray) low epithelial content. The color code representing the different splicing patterns is indicated at the bottom; (dark orange) complete exon exclusion; (bright yellow) complete exon inclusion.
FIGURE 3.
FIGURE 3.
The expression of cancer-associated splicing isoforms is regulated by a small group of splicing factors. (A) Strategy for the identification of cancer-associated splicing factors. The expression of all splicing factors identified in both the RefSeq database and the NCBI PubMed database (Lu 2011) was evaluated by quantitative RT-PCR in the different normal and cancer tissues described in Figure 1. The Venn diagram illustrates the tissue distribution of the splicing factors capable of discriminating between cancer and normal tissues by at least twofold (listed in Supplemental Table S6). (B) Depletion of the tumor-associated splicing factors alters the splicing pattern of the cancer stromal signature (CSS). The cancer-associated splicing factors were depleted using siRNA in the ovarian cancer cell line SKOV3ip1. The impact on the CES and CSS ASEs identified in Figure 2 was evaluated using quantitative RT-PCR. Exons inclusion (gray boxes) or exclusion (black boxes) generating a quantitative splicing shift (Prinos et al. 2011) (ΔQψ = QψKNOCKDOWNQψCONTROL) of at least 10 was considered significant and presented in the form of a table. For simplicity, only the ASEs regulated by at least one splicing factor and the splicing factors regulating at least one ASE are shown. The expression of all splicing factors except DDX39 was down-regulated in cancer tissues, and therefore the illustrated in vitro knockdown of these factors are expected to induce a splicing pattern similar to that detected in cancer tissues. (C) Illustration of the CES and CSS exon exclusion and inclusion events in the cancer epithelium and tumor microenvironment as detected by quantitative RT-PCR (see Supplemental Tables S2, S3). The cancer-associated genes were listed in the same order used in B, and their expression in cancer tissues is indicated as exon exclusion (black boxes) and inclusion (gray boxes).
FIGURE 4.
FIGURE 4.
RBFOX2 and QKI regulate the splicing of the CSS ASEs in a normal ovarian fibroblast cell line. (A) RBFOX2 and QKI expression levels in epithelial and fibroblast cell line. Global expression levels of QKI and RBFOX2 were monitored using quantitative RT-PCR in the immortalized normal ovarian fibroblast cell line (INOF) and compared with that obtained from the epithelial tumor cell lines OVCAR-3 and SKOV3ip1. SKOV3ip1 is an ovarian cancer cell line from epithelial origin that displays mesenchymal characters in cell culture. (B) Impact of RBFOX2 and QKI on the splicing of the CSS ASEs in the INOF cell line. The RNA was extracted from INOF cells transfected by two different siRNAs against QKI (QKI-1 and QKI-2), RBFOX2 (RBFOX2-1 and RBFOX2-2), or both QKI and RBFOX2 (RQ-1 and RQ-2). Shown is a bar graph representing the splicing shift of the different CSS events 72 h after transfection relative to mock-transfected cells by quantitative RT-PCR. The results are the average of three independent experiments. (C) Illustration of the CSS exon exclusion and inclusion events in the normal stroma and tumor microenvironment (see Supplemental Table S3) and INOF cell line (see B) as detected by quantitative RT-PCR. Grayscale with (black boxes) total exon exclusion and (white boxes) total exon inclusion is presented in the form of a table.
FIGURE 5.
FIGURE 5.
RBFOX2 and QKI regulate the expression of common splicing isoforms in the tumor microenvironment. (A) Identification of common RBFOX2 and QKI splicing targets. RBFOX2 and QKI were individually knocked down using two independent siRNAs in SKOV3ip1. The effect of the different knockdowns was evaluated by endpoint PCR using a set of 48 pre-established RBFOX2 targets and a set of 57 newly identified QKI targets (for details, see Materials and Methods). The 93 unique ASEs responding to the knockdown of at least one splicing factor are presented in the form of Venn diagram (i) (Supplemental Table S8, column 5). Quantitative RT-PCR primers were designed and validated for 76 out of 93 ASEs (ii) (Supplemental Table S8, column 6), and their splicing pattern in the tumor microenvironment or the epithelial and stromal normal tissues was tested (iii). (B) Comparison of the impact of RBFOX2 and QKI knockdown on the splicing of 37 common ASEs. The impact of RBFOX2 and QKI knockdown on the common set of 37 splicing targets discovered in A was plotted as a quantitative splicing shift (Prinos et al. 2011) (ΔQψ = QψKNOCKDOWNQψCONTROL) to generate a scatter graph. The Pearson correlation between the effect of RBFOX2 and QKI knockdown on splicing pattern and its P-value is indicated on the top right of the graph. (C) Common RBFOX2 and QKI targets are more likely to be associated with the tumor microenvironment than those affected by only one splicing factor. The bar graphs represent the percentage of the RBFOX2, QKI, or common RBFOX2 and QKI splicing targets (identified in A) associated with the tumor microenvironment as described in Figure 2A. (D) Schematic representation of the protein binding sites near RBFOX2- and QKI-responsive exons. The position of RBFOX2 and QKI binding sites (WGCAUG and ACUAAY) in seven common RBFOX2 and QKI splicing targets associated with the tumor microenvironment (identified in Fig. 3B and in panel Aiii) are indicated as “R” and “Q,” respectively. The existence of binding sites was verified in five regions: 250 nucleotides (nt) from the 5′ splice site of the upstream intron (a); 250 nt from the 3′ splice site of the upstream intron (b); within the exon (c); 250 nt from the 5′ splice site of the downstream intron (d); or 250 nt from the 3′ splice site of the downstream intron (e).
FIGURE 6.
FIGURE 6.
The common RBFOX2 and QKI splicing targets are deregulated in both ovarian and breast cancer. (A) The behavior of seven common RBFOX2 and QKI splicing targets associated with the tumor microenvironment was monitored using quantitative RT-PCR in 14 normal and 13 serous high-grade ovarian cancer tissues and their quantitative splicing pattern (Qψ) (Prinos et al. 2011) compared with that detected in 18 normal and 20 ductal breast cancer tissues (Supplemental Table S4). Shown are histograms representing the mean quantitative splicing shift (Prinos et al. 2011) (ΔQψ = QψTUMORQψNORMAL). (B) QKI expression is altered by different mechanisms in ovarian and breast cancer. The expression (left panel) (Supplemental Table S11) and splicing pattern (right panel) (Supplemental Table S10) of QKI was monitored by quantitative RT-PCR in breast and ovarian samples as described in A. The global expression pattern was calculated relative to housekeeping genes as previously described (Prinos et al. 2011), and the relative value is presented in the form of a bar graph. The splicing pattern of QKI isoforms 6 (short) and 7 (long) was calculated as the mean quantitative splicing shift (Prinos et al. 2011) (ΔQψ = QψTUMORQψNORMAL) as previously described in A and is plotted in the form of bar graphs. When significant, the P-value (t-test) of difference in expression or splicing shift is displayed on top of the histogram by asterisks ([*] P < 0.05; [**] P < 5.0 × 10⁻⁷).

References

    1. Agarwal A, Tressel SL, Kaimal R, Balla M, Lam FH, Covic L, Kuliopulos A 2010. Identification of a metalloprotease–chemokine signaling system in the ovarian cancer microenvironment: Implications for antiangiogenic therapy. Cancer Res 70: 5880–5890 - PMC - PubMed
    1. Auersperg N, Wong AS, Choi KC, Kang SK, Leung PC 2001. Ovarian surface epithelium: Biology, endocrinology, and pathology. Endocr Rev 22: 255–288 - PubMed
    1. Auweter SD, Fasan R, Reymond L, Underwood JG, Black DL, Pitsch S, Allain FH 2006. Molecular basis of RNA recognition by the human alternative splicing factor Fox-1. EMBO J 25: 163–173 - PMC - PubMed
    1. Barbolina MV, Burkhalter RJ, Stack MS 2011. Diverse mechanisms for activation of Wnt signalling in the ovarian tumour microenvironment. Biochem J 437: 1–12 - PMC - PubMed
    1. Bhowmick NA, Neilson EG, Moses HL 2004. Stromal fibroblasts in cancer initiation and progression. Nature 432: 332–337 - PMC - PubMed

Publication types

MeSH terms

LinkOut - more resources