. 2014 Mar;42(5):3089-103.
doi: 10.1093/nar/gkt1260. Epub 2013 Dec 13.

TDP1 deficiency sensitizes human cells to base damage via distinct topoisomerase I and PARP mechanisms with potential applications for cancer therapy

Affiliations

TDP1 deficiency sensitizes human cells to base damage via distinct topoisomerase I and PARP mechanisms with potential applications for cancer therapy

Meryem Alagoz et al. Nucleic Acids Res. 2014 Mar.

Abstract

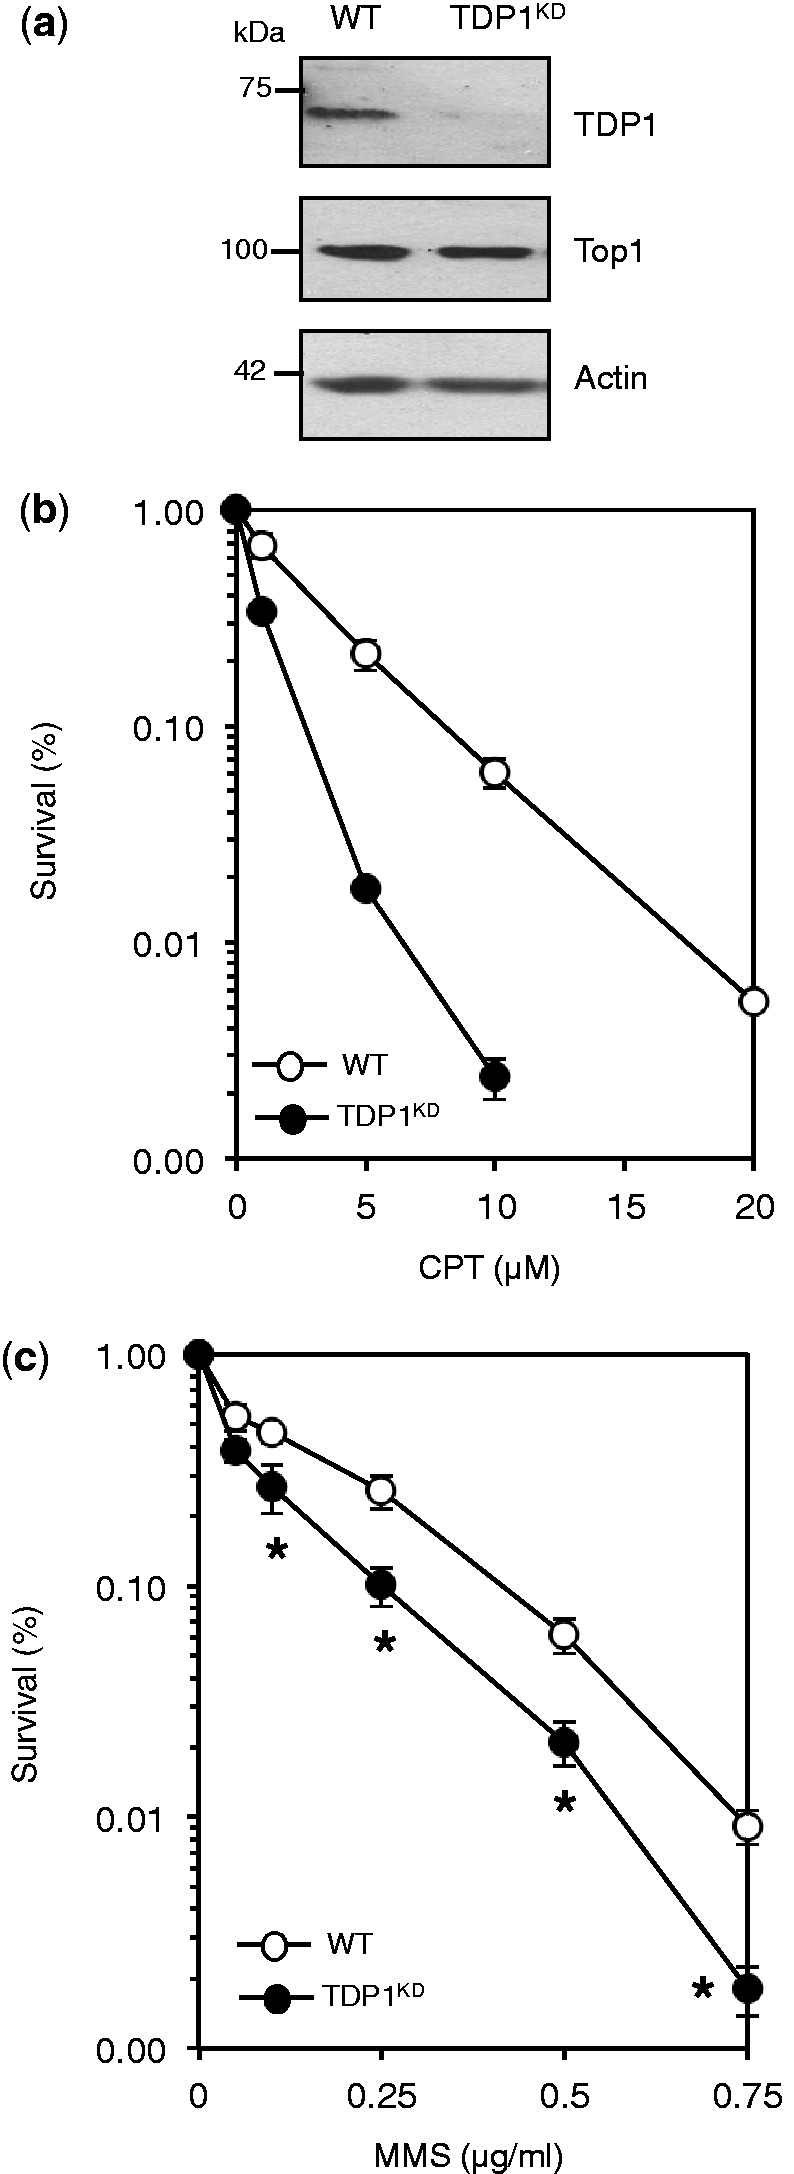
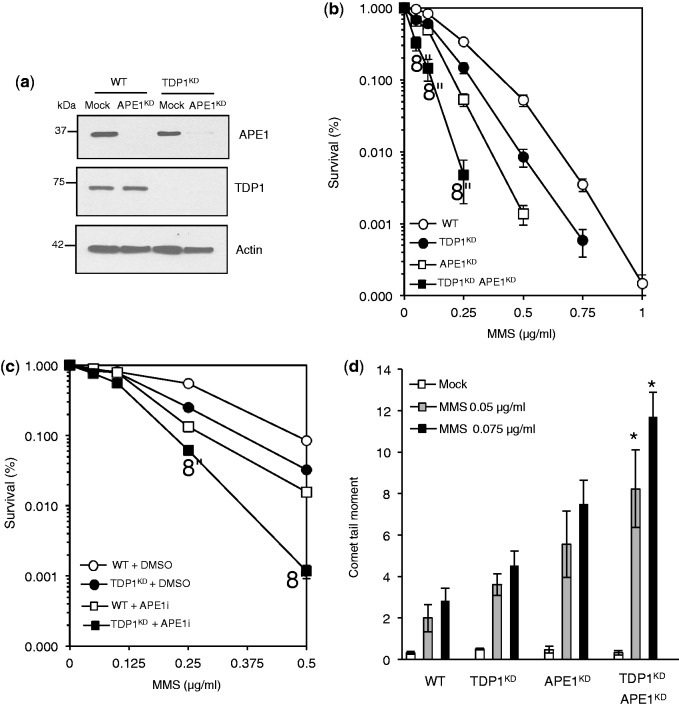
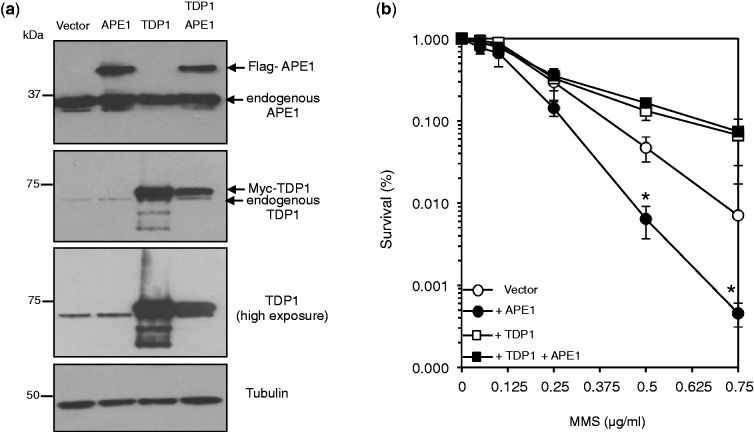
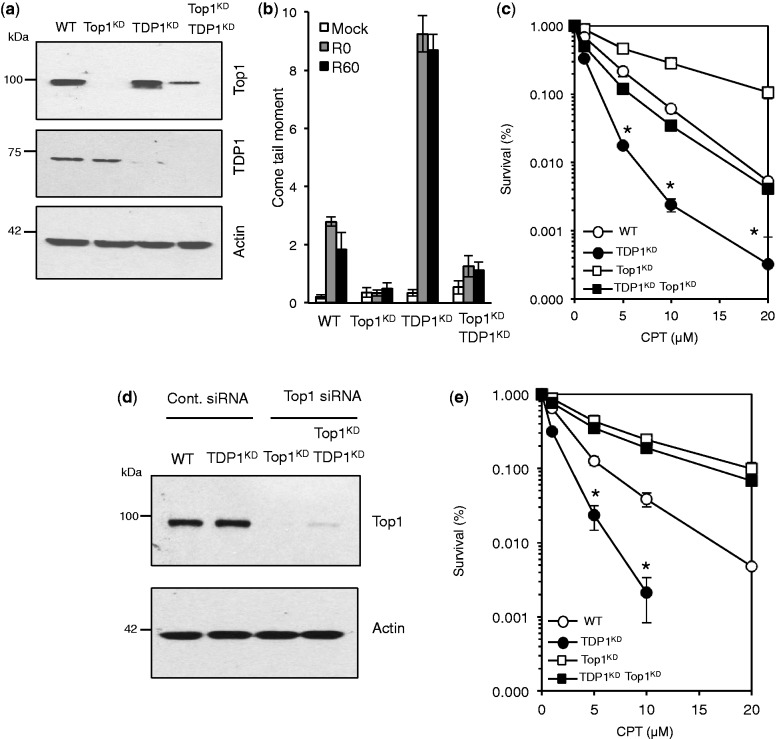
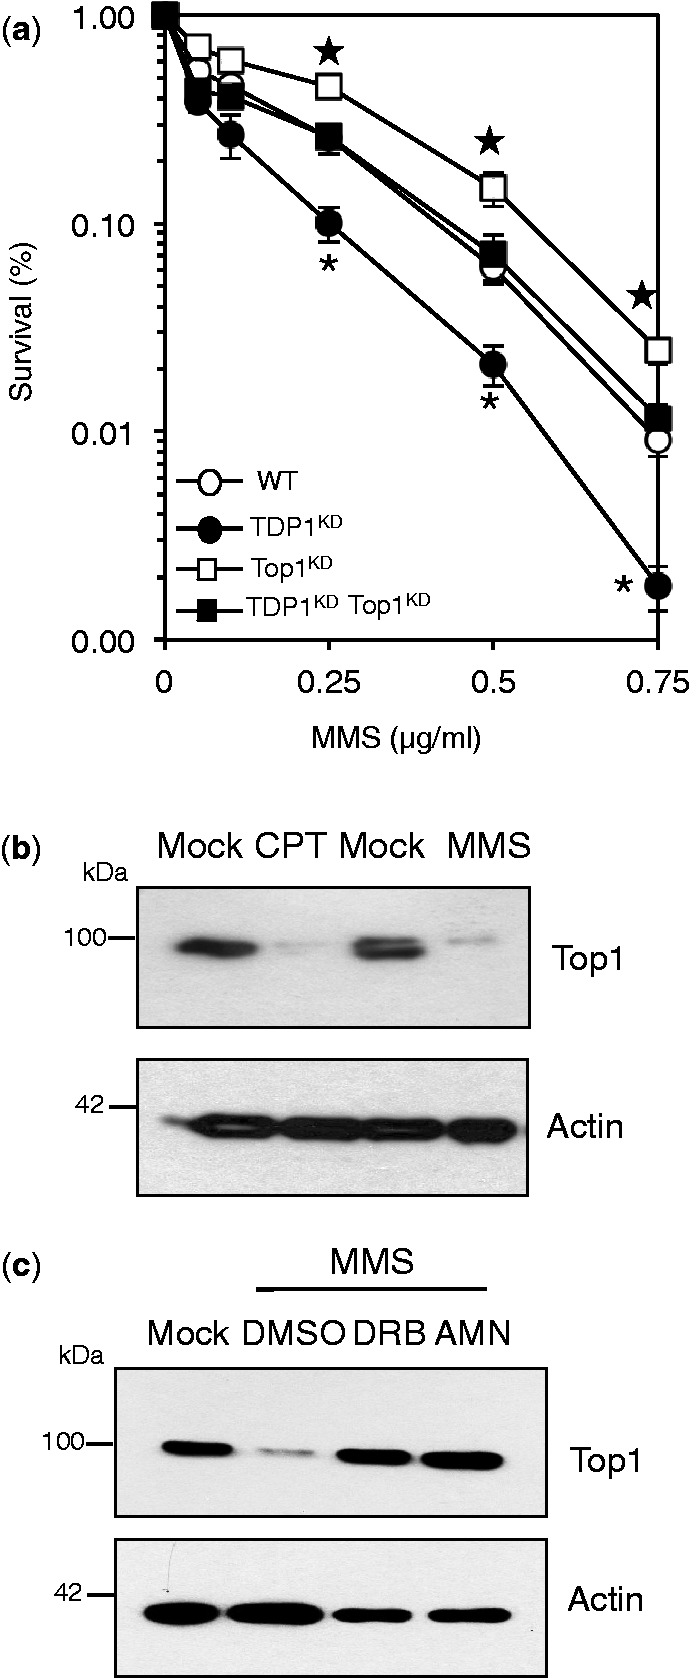
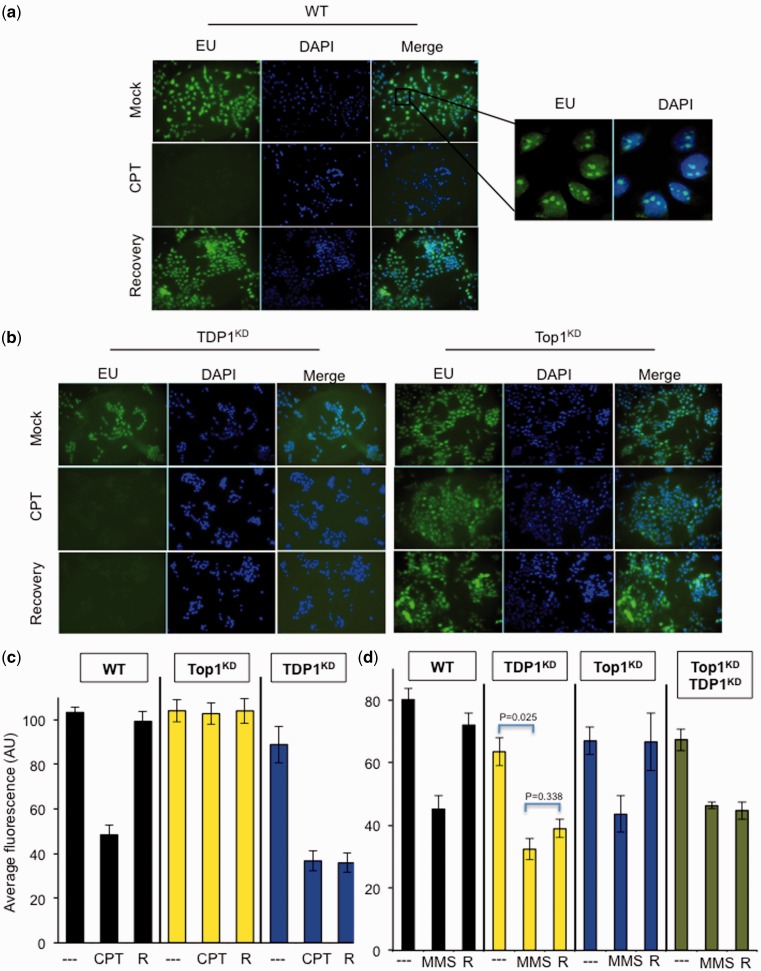
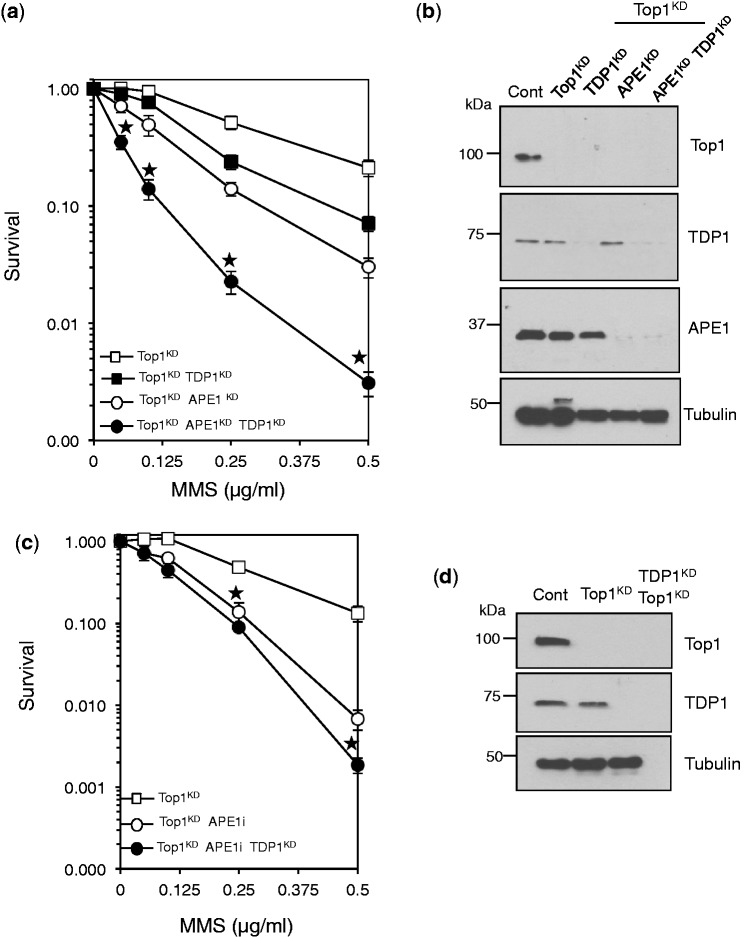
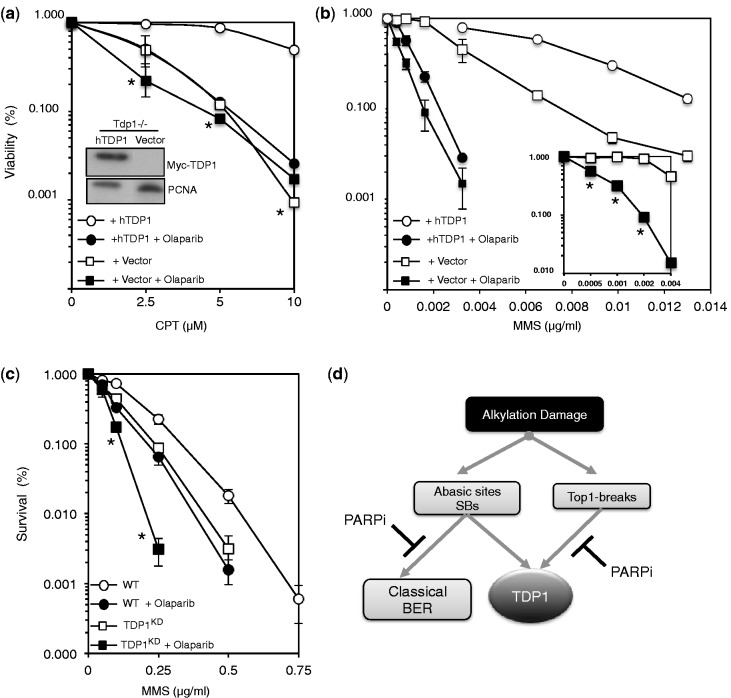
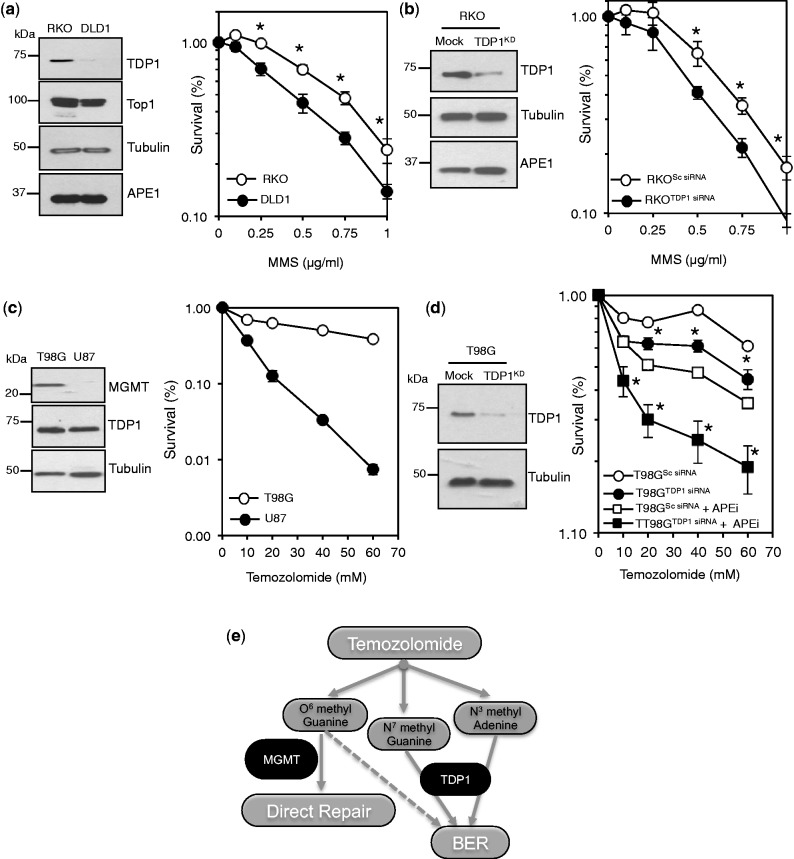
Base damage and topoisomerase I (Top1)-linked DNA breaks are abundant forms of endogenous DNA breakage, contributing to hereditary ataxia and underlying the cytotoxicity of a wide range of anti-cancer agents. Despite their frequency, the overlapping mechanisms that repair these forms of DNA breakage are largely unknown. Here, we report that depletion of Tyrosyl DNA phosphodiesterase 1 (TDP1) sensitizes human cells to alkylation damage and the additional depletion of apurinic/apyrimidinic endonuclease I (APE1) confers hypersensitivity above that observed for TDP1 or APE1 depletion alone. Quantification of DNA breaks and clonogenic survival assays confirm a role for TDP1 in response to base damage, independently of APE1. The hypersensitivity to alkylation damage is partly restored by depletion of Top1, illustrating that alkylating agents can trigger cytotoxic Top1-breaks. Although inhibition of PARP activity does not sensitize TDP1-deficient cells to Top1 poisons, it confers increased sensitivity to alkylation damage, highlighting partially overlapping roles for PARP and TDP1 in response to genotoxic challenge. Finally, we demonstrate that cancer cells in which TDP1 is inherently deficient are hypersensitive to alkylation damage and that TDP1 depletion sensitizes glioblastoma-resistant cancer cells to the alkylating agent temozolomide.


Figures

Figure 1.
Figure 1.
TDP1 promotes the repair of alkylation-induced base damage in human cells. (a) Human MRC5 cells were infected with lentivirus particles containing non-targeting control shRNA ‘WT’ or shRNA against human TDP1 ‘TDP1KD’. Cell lysates were fractionated by SDS–PAGE and analyzed by immunoblotting using anti-TDP1 (Eurogentec), anti-Top1 (Santa Cruz) or anti-actin (Sigma) immunoblotting. (b) WT or TDP1KD MRC5 cells were incubated with the indicated concentrations of camptothecin ‘CPT’ for 60 min at 37°C and the ability of single cells to form macroscopic colonies was determined by dividing the average number of colonies on treated plates by the average number of colonies on untreated plates and presented as percentage survival. Data are the mean ± s.e.m. of three biological replicates. (c) Survival was determined in WT and TDP1KD MRC5 cells following exposure to the indicated doses of the alkylating agent methyl methanesulfonate (MMS) for 15 min at 37°C as described in (a). Data are the mean ± s.e.m. of three biological replicates. Asterisks denote statistically significant difference between WT and TDP1KD (P = 0.04, 0.001, 0.02, 0.002 for MMS doses 0.1, 0.25, 0.5 and 0.75 μg/ml, respectively; t-test).
Figure 2.
Figure 2.
Human cells depleted for TDP1 and APE1 exhibit synergistic hypersensitivity to MMS. (a) WT or TDP1KD MRC5 cells were subjected to control non-targeting siRNA ‘Mock’ or siRNA against human APE1. Cell extract was fractionated by SDS–PAGE and analyzed by immunoblotting using anti-APE1 antibodies (Novus). (b) Control human MRC5 ‘WT’, TDP1KD, APE1KD or cells depleted for both APE1 and TDP1 ‘TDP1KD APE1KD’ were incubated with the indicated concentrations of MMS and percentage survival calculated from three independent replicates. Data are the mean ± s.e.m. Asterisks denote statistical difference (P < 0.01, t-test) between APE1KD and TDP1KD APE1KD cells (c) WT and TDPKD cells were incubated with DMSO or 150 μM of the APE1 inhibitor CRT0044876 ‘APEi’ for 2 h followed by an additional incubation with the indicated concentrations of MMS for 15 min at 37°C. Cell survival was calculated from the average of three independent experiments ± s.e.m. Asterisks denote statistical difference (P < 0.02; t-test) between mock and APEi-treated TDP1KD cells (d) MRC5 cells were incubated with the indicated doses of MMS for 15 min at 37°C and DNA SSBs and alkali labile sites quantified by alkaline comet assays. Average tail moment from 50 cells/sample was measured using Comet Assay IV software (Perceptive) and data are the average ± s.e.m. of three independent experiments. Asterisks denote statistical difference (P < 0.05; t-test) between APE1KD and TDP1KD APE1KD cells.
Figure 3.
Figure 3.
Overexpression of TDP1 protects human cells from MMS-induced DNA damage. (a) MRC5 cells were transfected with an empty mammalian expression vector ‘Vector’, or constructs encoding Flag-APE1, Myc-TDP1 or both. Expression of fusion proteins was analyzed by fractionating cell lysates using SDS–PAGE and immunoblotting, using anti-TDP1 (Eurogentec), anti-APE1 (Novus) or anti-tubulin (Sigma) antibodies. (b) MRC5 ectopically expressing Flag-APE1, Myc-TDP1 or both was incubated with the indicated concentrations of MMS and percentage survival calculated from three independent replicates. Data are the mean ± s.e.m. Asterisks denote statistical difference (P < 0.01;t-test) between cells overexpressing APE1 alone and cells expressing both APE1 and TDP1.
Figure 4.
Figure 4.
Depletion of Top1 protects human cells from camptothecin-induced cell death. (a) Control ‘WT’ or TDP1KD human MRC5 cells were subjected to lentivirus particles containing control non-targeting shRNA or shRNA against human Top1 ‘Top1KD’ to generate stable cells in which TDP1 or Top1 was depleted separately or together. Cell lysates were fractionated by SDS–PAGE and analyzed by immunoblotting using anti-TDP1 or anti-Top1 antibodies. (b) The indicated cell lines were incubated with 20 μM CPT for 1 h at 37°C and DNA strand breakage quantified using alkaline comet assays. Average tail moments from 50 cells/sample were measured, and data are the average ± s.e.m. of three independent experiments. (c) The indicated MRC5 cells were incubated with increasing concentrations of CPT for 60 min at 37°C and survival was determined from three biological replicates and presented as mean ± s.e.m. (d) Cells were additionally subjected to control siRNA or Top1 siRNA to deplete residual levels of Top1 in TDP1KD/Top1KD cells and cell lysate analyzed by SDS–PAGE and immunoblotting. (e) Control ‘WT’, TDP1KD, Top1KD or TDP1KD/Top1KD cells in which Top1 level was additionally depleted by siRNA were treated with increasing concentrations of CPT for 60 min at 37°C and survival determined from three biological replicates and presented as mean ± s.e.m. Asterisks denote statistical difference (P < 0.05; t-test) between TDP1KD and TDP1KD Top1KD cells.
Figure 5.
Figure 5.
Depletion of Top1 protects human cells from alkylation-induced DNA damage. (a) Control ‘WT’, TDP1KD, Top1KD or TDP1KD/Top1KD double mutant cells in which Top1 level was additionally depleted by siRNA were incubated with increasing concentrations of MMS for 15 min at 37°C. Survival was determined from three biological replicates and presented as mean ± s.e.m. Top1 depletion protects TDP1KD from MMS damage (Asterisks; P < 0.05; t-test between TDP1KD ‘closed circles’ and TDP1KD Top1KD cells ‘closed squares’). This protection did not fully restore resistance to levels observed in Top1KD cells (Stars; P < 0.01; t-test between Top1KD ‘open squares’ and TDP1KD Top1KD cells ‘closed squares’), suggesting that a proportion of MMS-induced breaks are processed by TDP1 in a Top1-independent manner. (b) Human MRC5 cells were incubated with 20 μM CPT or with 2 μg/ml MMS for 3 h at 37°C and cell lysate fractionated by SDS–PAGE and analyzed by immunoblotting. (c) MRC5 cells were incubated with DMSO or 50 μM 5,6-dichloro-1-β-D-ribofuranosylbenzimidazole ‘DRB’ for 1 h or with 1 μg/ml α-amanitin for 16 h followed by an additional 3 h incubation with 2 μg/ml MMS. Cell lysates were fractionated by SDS–PAGE and analyzed by immunoblotting.
Figure 6.
Figure 6.
TDP1 promotes transcription recovery following alkylation-induced DNA damage. (a) Control MRC5 cells ‘WT’ grown on coverslips were maintained for 2 days in serum-free media, treated with DMSO ‘Mock’ or with 20 μM CPT ‘CPT’ for 1 h and either harvested immediately after treatment or incubated in CPT-free media for a subsequent 3 h to allow for transcription recovery. Cells were incubated with 0.1 mM 5-ethynl uridine (EU) for 30 min to label newly synthesized RNA, which was visualized by using the Click iT reaction with Alexa Flour azide 488. EU-labeled RNA was subjected to immunofluorescence analyses and DNA counterstained with 4',6-diamidino-2-phenylindole (DAPI). Representative micrographs are depicted. (b) TDP1KD or Top1KD MRC5 cells were examined for nascent RNA synthesis as described in (a). (c) Average fluorescence signal (arbitrary units ‘AU’) from 200 to 300 cells as described in (a) and (b) were quantified from three biological replicates ± s.e.m. (d) The indicated MRC5 cells were grown in serum-free medium and treated with 2 μg/ml MMS for 15 min at 37°C. Cells were either harvested immediately after treatment ‘MMS’ or incubated in MMS-free media for a subsequent 1 h ‘R’. Newly synthesized RNA was quantified and average fluorescence signal of EU-labeled RNA was quantified as described earlier from three biological replicates.
Figure 7.
Figure 7.
Depletion of TDP1 sensitizes Top1KD/APE1KD cells to alkylation-induced DNA damage. (a) Top1KD cells were subjected to control siRNA or siRNA for TDP1 or APE1, separately or together and cells were incubated with increasing concentrations of MMS for 15 min at 37°C. Survival was determined from three biological replicates and presented as mean ± s.e.m. Asterisks; P < 0.05; t-test between Top1KD/TDP1KD ‘open circles’ and Top1KD/TDP1KD/APE1KD ‘closed circles’. (b) Lysates from cells described in ‘a’ were fractionated by SDS–PAGE and analyzed by immunoblotting. (c) Top1KD or Top1KD/TDP1KD cells were incubated with DMSO or 150 μM of the APE1 inhibitor CRT0044876 ‘APEi’ for 2 h followed by an additional incubation with the indicated concentrations of MMS for 15 min at 37°C. Cell survival was calculated from the average of three independent experiments (two biological replicates) ± s.e.m. Asterisks denote statistical difference (P < 0.05; t-test) between APEi treated Top1KD and Top1KD/TDP1KD cells. (d) Lysates from cells described in ‘c’ were fractionated by SDS–PAGE and analyzed by immunoblotting.
Figure 8.
Figure 8.
The PARP inhibitor Olaparib sensitizes TDP1-deficient cells to alkylation damage but not Top1 poisons. (a) Chicken DT40 Tdp1−/− cells were stably transfected with an empty mammalian expression vector ‘Vector’ or with a construct expressing human Myc-TDP1 ‘hTDP1’. Cells were pre-incubated with 0.5 μM of the PARP inhibitor Olaparib for 1 h at 39°C followed by additional incubation of the indicated concentrations of CPT for 72 h at 39°C. Viability was determined by quantifying fluorescence signals using CellTiter-Blue. Viability of untreated cells was set to 100% and error bars represent standard error from three independent biological repeats. Inset: DT40 cell lysate fractionated by SDS–PAGE and analyzed by anti-Myc (9B11; Cell signaling) and anti-PCNA (PC10) immunoblotting. Asterisks denote statistical differences (P > 0.1; t-test) between Vector alone ‘open squares’ and Vector + Olaparib ‘closed squares’ (b) Viability of the indicated DT40 cells was analyzed in presence or absence of Olaparib as described earlier in text, following incubation with the indicated concentrations of MMS for 72 h. Data are the average of three independent repeats ± s.e.m. Asterisks denote statistical differences (P < 0.02; t-test) between Vector alone ‘open squares’ and Vector + Olaparib ‘closed squares’ Inset: survival curves as described earlier in the text following incubation with a lower dose range of MMS (c) WT and TDP1KD human MRC5 cells were pre-incubated with 1 μM Olaparib for 60 min followed by additional incubation with the indicated concentrations of MMS for 15 min at 37°C. Survival was determined from three independent repeats and data are the average ± s.e.m. Asterisks denote statistical differences (P < 0.01, t-test) between TDP1KD ‘open squares’ and TDP1KD + Olaparib ‘closed squares’ (d) Model for the repair of alkylation-induced DNA damage by TDP1. Base damage induces both Top1- and AP/3’-dRP DNA breaks. The former are dealt with TDP1 in a PARP-dependent process, whereas the latter are processed in a PARP-independent mechanism. PARP activity appears to promote TDP1 alternative pathways in response to alkylation damage, which likely involves canonical base excision repair factors such as APE1.
Figure 9.
Figure 9.
TDP1 depletion sensitizes glioblastoma-resistant cancer cells to temozolomide. (a) Cell lysates from RKO and DLD1 cancer cell lines were fractionated by SDS–PAGE and analyzed by immunoblotting using anti-TDP1 (Eurogentec), anti-Top1 (Santa Cruz), anti-Tubulin (Abcam) and anti-APE1 (Novus) antibodies (left). RKO and DLD1 cells were compared for their survival following exposure with the indicated doses of MMS for 15 min at 37°C (right). Data are the average of three independent experiments ± s.e.m. Where not visible, error bars are smaller than the symbol. (b) RKO cells were subjected to scrambled siRNA (Mock) or siRNA against TDP1 (TDP1KD) and cell lysates analyzed by immunoblotting (left). Control RKO (RKOSc siRNA) and RKO cells in which TDP1 levels were depleted (RKOTDP1 siRNA) were examined for their survival following exposure to the indicated doses of MMS, as described earlier in the text (right). (c) Glioblastoma multiforme T98G and U87 cancer cell lines were analyzed for methylguanine methyltransferase (MGMT) expression using anti-MGMT antibodies (Abcam) (left). High-MGMT expressing T98G cells were compared with low-MGMT expressing U87 cells for their survival following exposure to increasing concentrations of the alkylating agent temozolomide (right). (d) TG98 cells were subjected to scrambled siRNA (Mock) or siRNA against TDP1 (TDP1KD) and cell lysates analyzed by immunoblotting (left). Control T98G cells (T98GSc siRNA) and cells in which TDP1 levels were depleted (TG98TDP1 siRNA) were incubated with DMSO or 150 μM of the APE1 inhibitor CRT0044876 ‘APEi’ for 2 h followed by additional incubation with the indicated concentrations of MMS for 15 min at 37°C. Cell survival was blindly scored from three independent biological repeats, and data are the average ± s.e.m. (right). (e) Model for the repair of temozolomide-induced DNA breaks. Temozolomide delivers a methyl group to purine bases of DNA, resulting in O6-methyl guanine, N7-methyl guanine and N3-methyl adenine. The primary cytotoxic lesion is believed to be O6-methyl guanine, which can be removed by a direct repair mechanism mediated by methylguanine methyltransferase (MGMT). Inherent and acquired resistance to temozolomide via MGMT expression presents a major challenge in cancer therapy, particularly for glioblastoma multiforme. TDP1 promotes the repair of methylated purines induced by temozolomide via a distinct non-canonical BER pathway. Increasing the load of unrepaired methylated purines by exploiting the limited availability of TDP1 alone or in combination with canonical BER factors such as APE1 provides a new synthetic lethal setting to improve the clinical outcome of temozolomide-based cancer therapy. Asterisks denote statistical differences (P < 0.05; t-test) between control and TDP1-deficient cells.

References

    1. Lindahl T, Nyberg B. Rate of depurination of native deoxyribonucleic acid. Biochemistry. 1972;11:3610–3618. - PubMed
    1. Rydberg B, Lindahl T. Nonenzymatic methylation of DNA by the intracellular methyl group donor S-adenosyl-L-methionine is a potentially mutagenic reaction. EMBO J. 1982;1:211–216. - PMC - PubMed
    1. Hecht SS. DNA adduct formation from tobacco-specific N-nitrosamines. Mutat. Res. 1999;424:127–142. - PubMed
    1. Kato S, Bowman ED, Harrington AM, Blomeke B, Shields PG. Human lung carcinogen-DNA adduct levels mediated by genetic polymorphisms in vivo. J. Natl Cancer Inst. 1995;87:902–907. - PubMed
    1. Lindahl T. Instability and decay of the primary structure of DNA. Nature. 1993;362:709–715. - PubMed

Publication types

MeSH terms

Substances