. 2014 Mar;111(5):1077-87.
doi: 10.1152/jn.00749.2012. Epub 2013 Dec 11.

Primary auditory cortical responses to electrical stimulation of the thalamus

Affiliations

Primary auditory cortical responses to electrical stimulation of the thalamus

Craig A Atencio et al. J Neurophysiol. 2014 Mar.

Abstract

Cochlear implant electrical stimulation of the auditory system to rehabilitate deafness has been remarkably successful. Its deployment requires both an intact auditory nerve and a suitably patent cochlear lumen. When disease renders prerequisite conditions impassable, such as in neurofibromatosis type II and cochlear obliterans, alternative treatment targets are considered. Electrical stimulation of the cochlear nucleus and midbrain in humans has delivered encouraging clinical outcomes, buttressing the promise of central auditory prostheses to mitigate deafness in those who are not candidates for cochlear implantation. In this study we explored another possible implant target: the auditory thalamus. In anesthetized cats, we first presented pure tones to determine frequency preferences of thalamic and cortical sites. We then electrically stimulated tonotopically organized thalamic sites while recording from primary auditory cortical sites using a multichannel recording probe. Cathode-leading biphasic thalamic stimulation thresholds that evoked cortical responses were much lower than published accounts of cochlear and midbrain stimulation. Cortical activation dynamic ranges were similar to those reported for cochlear stimulation, but they were narrower than those found through midbrain stimulation. Our results imply that thalamic stimulation can activate auditory cortex at low electrical current levels and suggest an auditory thalamic implant may be a viable central auditory prosthesis.

Keywords: anodic stimulation; auditory thalamic implant; cathodic stimulation; deafness; medial geniculate body.


Figures
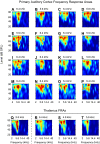
Fig. 1.
Fig. 1.
Example frequency response areas (FRAs) from primary auditory cortex (AI) and the ventral division of the medial geniculate body (vMGB). A–P: FRAs for 16 AI cortical sites recorded from 1 multichannel probe penetration. Each probe had 4 shanks, with 4 recording channels per shank. The estimated characteristic frequency (CF) is noted above each FRA. Q: FRA from a recording site in the vMGB that was later electrically stimulated. When the thalamic site in Q was electrically stimulated, AI responses were recorded at the locations in A–P. R–T: 3 additional example thalamic FRAs recorded from different locations in the thalamus.
Fig. 2.
Fig. 2.
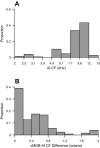
CF distribution. A: CFs of sampled cortical sites. B: difference between CFs from simultaneously sampled vMGB and AI sites.
Fig. 3.
Fig. 3.
Cortical poststimulus time histograms (PSTHs) for cathodic thalamic electrical stimulation. An example PSTH from 1 cortical recording site is shown. Increasing electrical stimulation levels lead to increasing cortical responses. Gray boxes represent the duration of the recorded electrical artifact.
Fig. 4.
Fig. 4.
Example cortical activation curve. Responses from a recording site evoked by thalamic electrical stimulation are shown. The activation curve was fitted with a sigmoidal function, and multiple parameters were obtained: RLow, lower asymptotic response level; RHigh, upper asymptotic response level; R25% and R75%, response levels 25% and 75% above RLow; C25% and C75%, currents corresponding to the response levels 25% and 75% above RLow; and DR, dynamic range (in dB) between C25% and C75%.
Fig. 5.
Fig. 5.
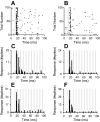
Cortical response rasters and pulse train responses. A and B: example responses from 2 cortical sites to 20-μA single-pulse vMGB electrical stimulation show neural response variability. C–F: example responses from 4 cortical sites to electrical stimulation pulse trains at 20-μA current levels. Pulse train frequency was 120 pulses/s. Response profiles confirm antidromic fatigue. Gray bars indicate electrical stimulation artifacts.
Fig. 6.
Fig. 6.
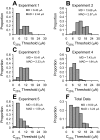
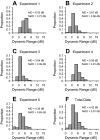
C25% threshold level for cathodic thalamic electrical stimulation. A–E: threshold distributions from 5 experiments. F: distribution of thresholds obtained by combining all data in A–E. MD, median; MAD, median absolute deviation.
Fig. 7.
Fig. 7.
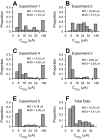
Upper-response current levels for cathodic thalamic electrical stimulation. C75% corresponds to 75% of the maximum response value (see Fig. 4). A–E: C75% value distributions from 5 different experiments. The last bin (>36) indicates sites where C75% could not be determined using the applied electrical stimulation current levels. F: C75% distribution obtained by combining all data in A–E.
Fig. 8.
Fig. 8.
Dynamic range for cathodic thalamic electrical stimulation. A–E: dynamic range (in dB) from 5 different experiments. F: dynamic range distribution obtained by combining all data in A–E.
Fig. 9.
Fig. 9.
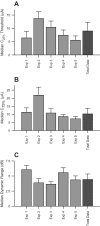
Summary of cortical response measures. A: median threshold current levels for all 5 experiments (Exp 1–5) and combined total data. B: median C75% values. C: median dynamic range values. Error bars represent MAD.
Fig. 10.
Fig. 10.
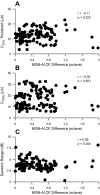
Threshold (C25%), upper response current level (C75%), and dynamic range vs. vMGB-AI CF difference. A: threshold vs. CF difference (r = −0.11, P = 0.202, t-test). B: C75% vs. CF difference (r = −0.05, P < 0.561, t-test). C: dynamic range vs. CF difference (r = 0.09, P = 0.305, t-test). To differentiate points, abscissa points were jittered.
Fig. 11.
Fig. 11.
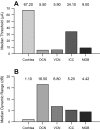
Summary of results for median threshold and median dynamic range for electrical stimulation of key auditory stations. A: median threshold of cortical responses to cochlear, dorsal cochlear nucleus (DCN), ventral cochlear nucleus (VCN), midbrain (ICC), and thalamic (vMGB) electrical stimulation. B: median dynamic range of cortical responses to electrical stimulation at key lemniscal auditory stations. Data for cochlear and midbrain stimulation (Bierer and Middlebrooks 2002; Lim and Anderson 2006) and for DCN and VCN stimulation (Takahashi et al. 2005) were replotted.

Similar articles

Cited by

References

    1. Bierer JA, Middlebrooks JC. Auditory cortical images of cochlear-implant stimuli: dependence on electrode configuration. J Neurophysiol 87: 478–492, 2002 - PubMed
    1. Calixto R, Lenarz M, Neuheiser A, Scheper V, Lenarz T, Lim HH. Co-activation of different neurons within an isofrequency lamina of the inferior colliculus elicits enhanced auditory cortical activation. J Neurophysiol 108: 1199–1210, 2012 - PubMed
    1. Cant NB, Benson CG. Multiple topographically organized projections connect the central nucleus of the inferior colliculus to the ventral division of the medial geniculate nucleus in the gerbil, Meriones unguiculatus. J Comp Neurol 503: 432–453, 2007 - PubMed
    1. Cant NB, Benson CG. Organization of the inferior colliculus of the gerbil (Meriones unguiculatus): differences in distribution of projections from the cochlear nuclei and the superior olivary complex. J Comp Neurol 495: 511–528, 2006 - PMC - PubMed
    1. Cetas JS, Price RO, Crowe J, Velenovsky DS, McMullen NT. Dendritic orientation and laminar architecture in the rabbit auditory thalamus. J Comp Neurol 458: 307–317, 2003 - PubMed

Publication types