. 2014 Feb;164(2):1077-92.
doi: 10.1104/pp.113.230052. Epub 2013 Dec 13.

Multiple rice microRNAs are involved in immunity against the blast fungus Magnaporthe oryzae

Affiliations

Multiple rice microRNAs are involved in immunity against the blast fungus Magnaporthe oryzae

Yan Li et al. Plant Physiol. 2014 Feb.

Abstract

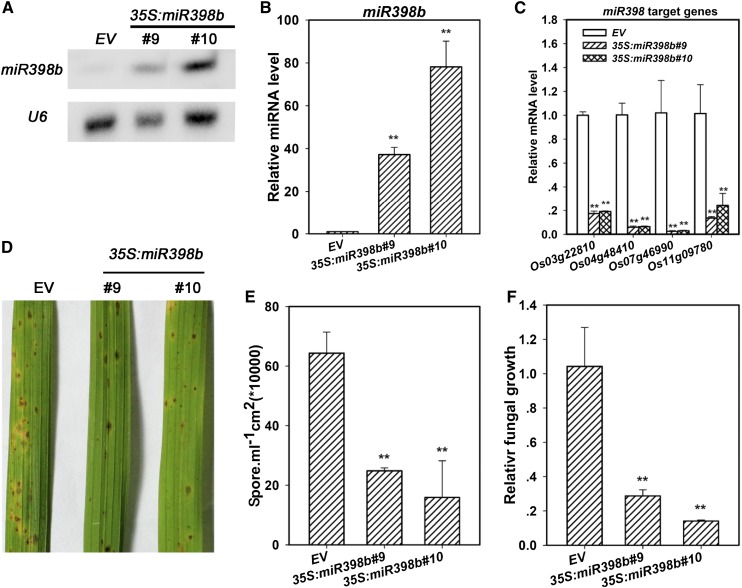
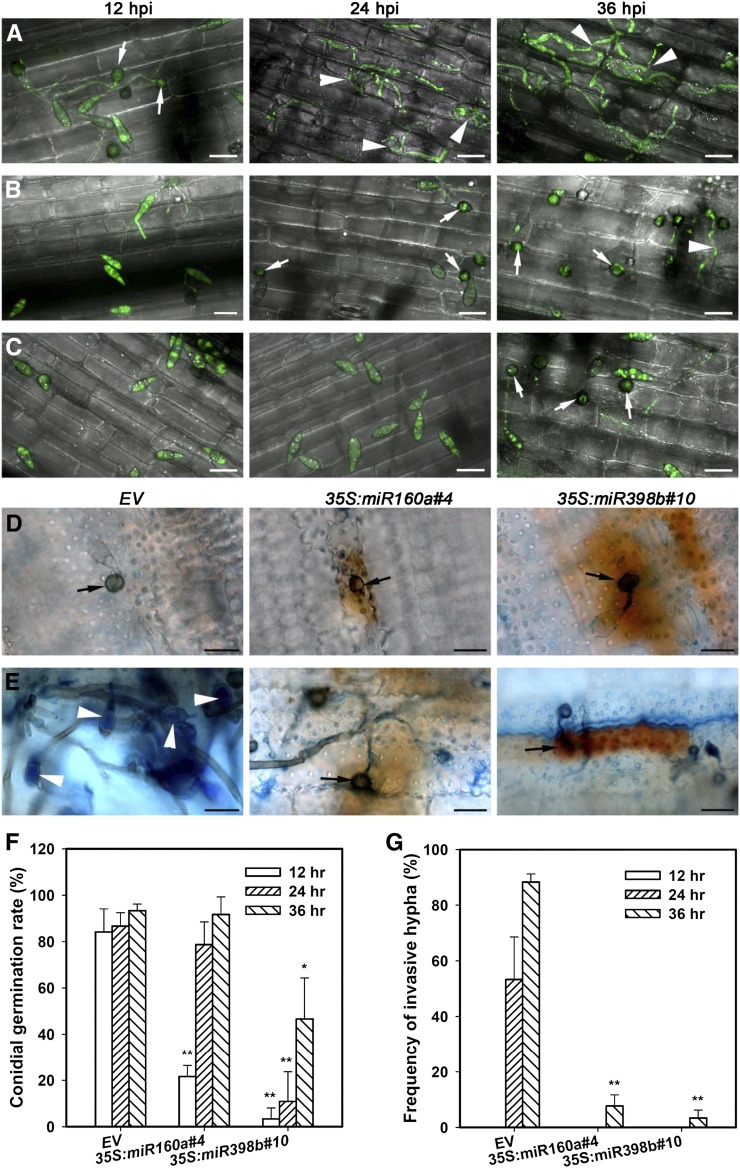
MicroRNAs (miRNAs) are indispensable regulators for development and defense in eukaryotes. However, the miRNA species have not been explored for rice (Oryza sativa) immunity against the blast fungus Magnaporthe oryzae, the most devastating fungal pathogen in rice production worldwide. Here, by deep sequencing small RNA libraries from susceptible and resistant lines in normal conditions and upon M. oryzae infection, we identified a group of known rice miRNAs that were differentially expressed upon M. oryzae infection. They were further classified into three classes based on their expression patterns in the susceptible japonica line Lijiangxin Tuan Hegu and in the resistant line International Rice Blast Line Pyricularia-Kanto51-m-Tsuyuake that contains a single resistance gene locus, Pyricularia-Kanto 51-m (Pikm), within the Lijiangxin Tuan Hegu background. RNA-blot assay of nine of them confirmed sequencing results. Real-time reverse transcription-polymerase chain reaction assay showed that the expression of some target genes was negatively correlated with the expression of miRNAs. Moreover, transgenic rice plants overexpressing miR160a and miR398b displayed enhanced resistance to M. oryzae, as demonstrated by decreased fungal growth, increased hydrogen peroxide accumulation at the infection site, and up-regulated expression of defense-related genes. Taken together, our data indicate that miRNAs are involved in rice immunity against M. oryzae and that overexpression of miR160a or miR398b can enhance rice resistance to the disease.


Figures

Figure 1.
Figure 1.
Comparison of defense responses among the susceptible line LTH and two monogenic resistant lines. Three-leaf-old seedlings were inoculated with spore suspensions (5 × 10⁵ spores mL−1) of M. oryzae, and disease phenotypes were recorded at 10 dpi. A, Representative leaf sections from the indicated lines to show the blast disease phenotypes. B to F, Expression of the indicated defense-related genes in LTH, IRBLkm-Ts, and IRBLz5-CA upon M. oryzae infection. RNA was extracted at the indicated time points for qRT-PCR analysis. mRNA level was normalized to that in untreated LTH (0 h). Error bars indicate sd. Student’s t test was carried out to determine the significance of differences between LTH and IRBLkm-Ts or IRBLz5-CA. Double asterisks indicate significant differences (P < 0.01). The experiments were repeated two times with similar results. G, Representative leaf sections from the indicated lines to show fungal growth and H2O2 accumulation at 2 and 10 dpi, respectively. Note that there was no or trace amounts of H2O2 accumulation in LTH (arrow), but high levels were seen around the appressoria (arrowheads) at 2 dpi in the leaf cells of both IRBLkm-Ts and IRBLz5-CA. Trypan blue and DAB were used to stain the fungal structure and H2O2 accumulation (reddish brown), respectively. Bars = 10 μm. [See online article for color version of this figure.]
Figure 2.
Figure 2.
Profiling of small RNAs by deep sequencing of the libraries from different samples. Small RNA libraries were constructed from samples of the indicated lines collected at 0, 12, and 24 hpi with M. oryzae and subjected to deep sequencing. A, Size distribution of sequenced small RNAs mapped to the rice genome. B, Size distribution of miRNAs mapped to the miRNA precursor. C, Bar charts summarizing the percentage of small RNA reads matched to the rice and M. oryzae genomes. D, Bar charts summarizing the percentage of small RNA reads matched to different rice RNAs. hc-siRNA, Heterochromatic siRNA; nat-siRNA, natural antisense short siRNA; ta-siRNA, trans-acting siRNA. [See online article for color version of this figure.]
Figure 3.
Figure 3.
Expression patterns of miRNAs and their target genes upon M. oryzae infection. Three-leaf-old seedlings were inoculated with 5 × 10⁵ spores mL−1 M. oryzae, and total RNA was extracted from leaves of the indicated lines at the indicated time points. A, RNA-blot analysis of miRNAs. Fifteen micrograms of small RNA was loaded. RNA blots were hybridized with DNA oligonucleotide probes complementary to the indicated miRNAs. U6 was used as a loading control. Values below each section represent the relative abundance of miRNA normalized to U6. B to G, qRT-PCR analyses of mRNA levels for genes targeted by miR160 (B; Os04g43910/ARF16), miR164 (C; Os12g41680), miR827 (D; Os04g48390), miR172 (E; Os05g03040), and miR398 (F and G; Os07g46990/SOD2 and Os04g48410). Error bars indicate sd. Student’s t test was used to determine the significance of differences between 0 hpi and the indicated time points in the same line. Asterisks indicate significant differences (*P < 0.05 and **P < 0.01). The experiments were repeated two times with similar results.
Figure 4.
Figure 4.
Overexpression of miR160a enhances rice resistance to M. oryzae. A and B, RNA-blot analysis (A) and qRT-PCR assay (B) to examine the accumulation of miR160a in the indicated transgenic lines expressing 35S:miR160a or empty vector (EV). One microgram of total RNA was used for qRT-PCR analysis, and 15 μg of small RNA was loaded for RNA-blot analysis. C, qRT-PCR assay for the indicated three target genes of miR160a in the indicated transgenic lines. RNA was extracted from the T2 generation of 35S:MIR160a transgenic plants. D, Representative leaf sections from the indicated transgenic lines show the disease phenotypes. Three-leaf-old seedlings were inoculated with 5 × 10⁵ spores mL−1 M. oryzae, and the phenotype was observed at 10 dpi. E and F, Sporulation (E) and relative fungal growth (F) on the inoculated leaves of the indicated transgenic lines. Samples were taken for the assays at 10 dpi. Values are means of three replications. Error bars indicate sd. Student’s t test was carried out to determine the significance of differences between Kasalath (empty vector) and miR160a overexpression transgenic plants. Asterisks indicate significant differences (*P < 0.05 and **P < 0.01). The experiments were repeated two times with similar results. [See online article for color version of this figure.]
Figure 5.
Figure 5.
Overexpression of miR398b enhances rice resistance to M. oryzae. A and B, RNA-blot analysis (A) and qRT-PCR assay (B) to examine the accumulation of miR398b in the indicated transgenic lines expressing 35S:miR398b or empty vector (EV). One microgram of total RNA was used for qRT-PCR analysis, and 20 μg of small RNA was loaded for RNA-blot analysis. C, qRT-PCR assay for the indicated four target genes of miR398b in the indicated transgenic lines. D, Representative leaf sections from the indicated transgenic lines to show the disease phenotypes. Three-leaf-old transgenic rice seedlings were inoculated with 5 × 10⁵ spores mL−1 M. oryzae, and the phenotype was observed at 10 dpi. E and F, Quantitative assays for sporulation (E) and relative fungal growth (F) on the inoculated leaves of the indicated transgenic lines. Samples were collected at 10 dpi. Values are means of three replications. Error bars indicate sd. Student’s t test was carried out to determine the significance of differences between Kasalath (empty vector) and miR398b overexpression transgenic plants. Asterisks indicate significant differences (**P < 0.01). The experiments were repeated two times with similar results. [See online article for color version of this figure.]
Figure 6.
Figure 6.
miR160a and miR398b positively and differentially regulate the expression of defense-related genes. Three-leaf-old seedlings were inoculated with 5 × 10⁵ spores mL−1 M. oryzae, and samples were collected at the indicated time points. RNA was extracted for qRT-PCR analysis, and the mRNA level was normalized to that in untreated control Kasalath (empty vector [EV]). A and B, qRT-PCR assay showing that the late-responsive defense-related genes PR1 (A) and PR10 (B) were up-regulated in the miR160a and miR398b overexpression lines. C and D, qRT-PCR assay showing that the PTI-related genes OsKS4 and OsNAC4 were up-regulated in the transgenic line overexpressing miR398b but not in that overexpressing miR160a. E and F, qRT-PCR assay showing the expression levels of PTI-related genes OsKS4 and OsNAC4 in the indicated transgenic lines after incubating in water, 1 μg mL−1 chitin, or 1 μm flg22 for 1 h. Note that OsKS4 and OsNAC4 were significantly induced by both chitin and flg22 in the transgenic line overexpressing miR398b but not in that overexpressing miR160a. Values are means of three replications. Error bars indicate sd. Student’s t test was carried out to determine the significance of differences between Kasalath (empty vector) and miRNA overexpression transgenic plants following M. oryzae or PAMP treatment. Asterisks indicate significant differences (*P < 0.05 and **P < 0.01). The experiments were repeated two times with similar results.
Figure 7.
Figure 7.
Cellular responses to the infection of M. oryzae. A to C, Representative laser scanning confocal microscopy images to show infection of the eGFP-tagged strain Zhong-8-10-14 on sheath cells of transgenic plants expressing empty vector (A), 35S:miR160a (B), and 35S:miR398b (C) at the indicated time points. Note that appressoria (arrows) were formed at 12 hpi on empty vector plants but delayed to 24 hpi on miR160a overexpression plants and to 36 hpi on miR398b overexpression plants. Invasive hyphae (arrowheads) were formed at 24 hpi and extended to the neighbor cells at 36 hpi on empty vector plants. Bars = 20 μm. D and E, Representative leaf sections from the indicated transgenic lines stained by DAB and trypan blue at 2 dpi (D) and 10 dpi (E) to show the accumulation of H2O2 (reddish brown) at the infection site where appressoria (arrows) were visualized and the fungal structures. Note that secondary conidia (arrowheads in E) were generated on empty vector (EV) plants at 10 dpi. Bars = 10 μm. F and G, Statistical analyses of conidial germination rate (F) and frequency of invasive hyphae (G) at the indicated time points observed on the indicated lines. Inoculated leaves were stained with trypan blue and examined by microscopy. Data are means ± se from three independent experiments, in each of which more than 200 conidia were evaluated. The χ2 test was used to test statistical significance between empty vector and transgenic lines. Asterisks indicate significant differences (*P < 0.05 and **P < 0.01). [See online article for color version of this figure.]

Similar articles

Cited by

References

    1. Alfano JR, Collmer A. (2004) Type III secretion system effector proteins: double agents in bacterial disease and plant defense. Annu Rev Phytopathol 42: 385–414 - PubMed
    1. Ashikawa I, Hayashi N, Yamane H, Kanamori H, Wu J, Matsumoto T, Ono K, Yano M. (2008) Two adjacent nucleotide-binding site-leucine-rich repeat class genes are required to confer Pikm-specific rice blast resistance. Genetics 180: 2267–2276 - PMC - PubMed
    1. Baulcombe D. (2004) RNA silencing in plants. Nature 431: 356–363 - PubMed
    1. Berruyer R, Poussier S, Kankanala P, Mosquera G, Valent B. (2006) Quantitative and qualitative influence of inoculation methods on in planta growth of rice blast fungus. Phytopathology 96: 346–355 - PubMed
    1. Beyer W, Imlay J, Fridovich I. (1991) Superoxide dismutases. Prog Nucleic Acid Res Mol Biol 40: 221–253 - PubMed

Publication types

MeSH terms