. 2013 Dec 11;11(91):20130921.
doi: 10.1098/rsif.2013.0921. Print 2014 Feb 6.

Vision-based flight control in the hawkmoth Hyles lineata

Affiliations

Vision-based flight control in the hawkmoth Hyles lineata

Shane P Windsor et al. J R Soc Interface. .

Abstract

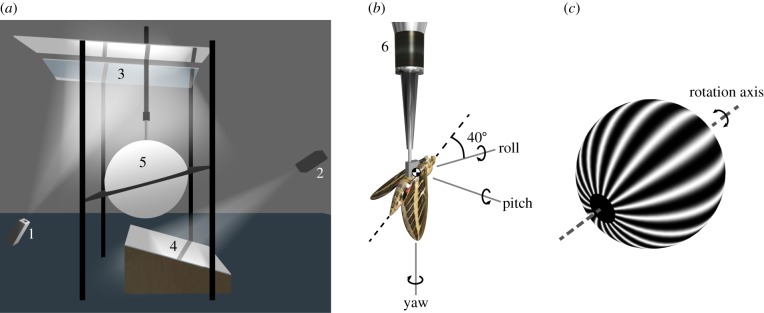
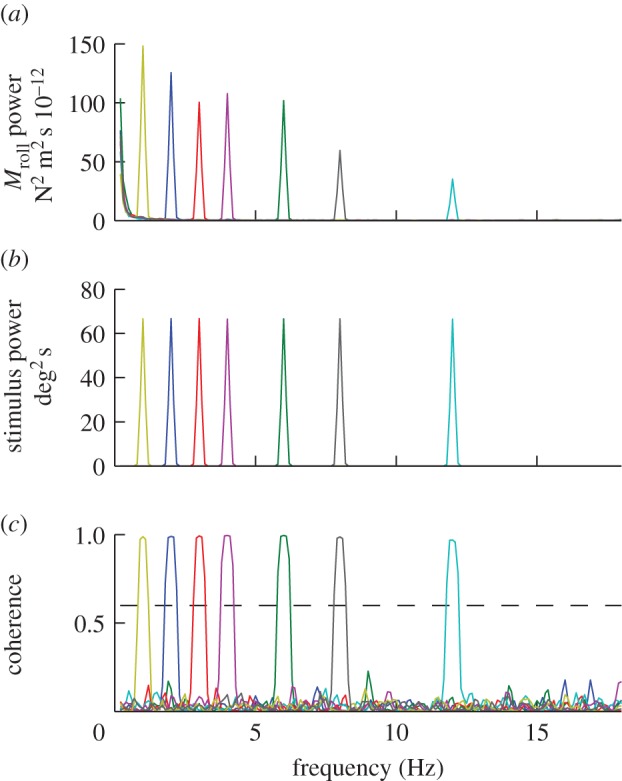
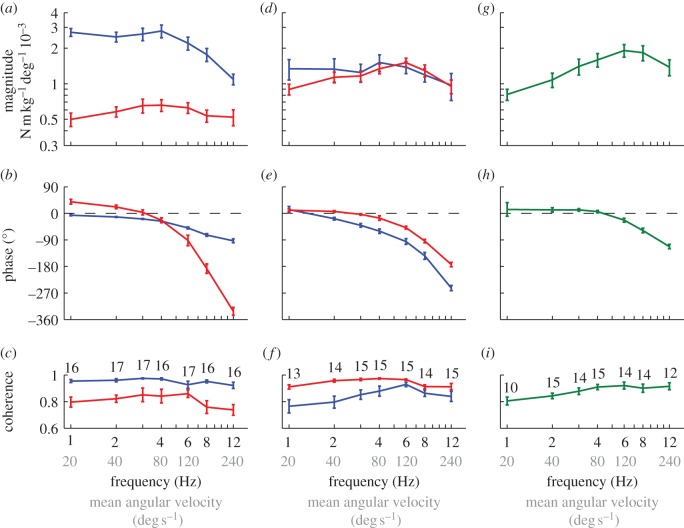
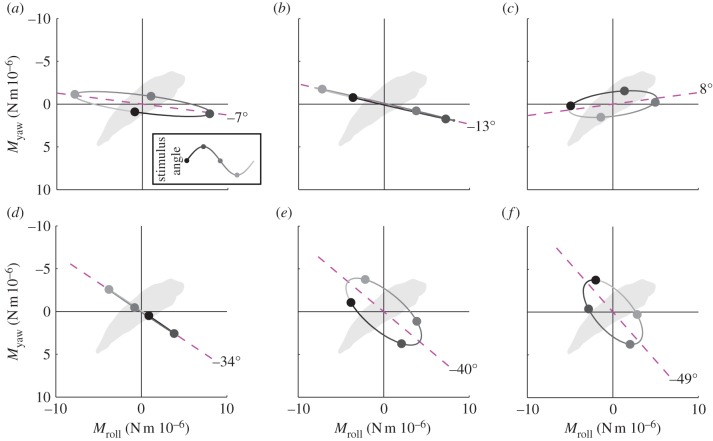
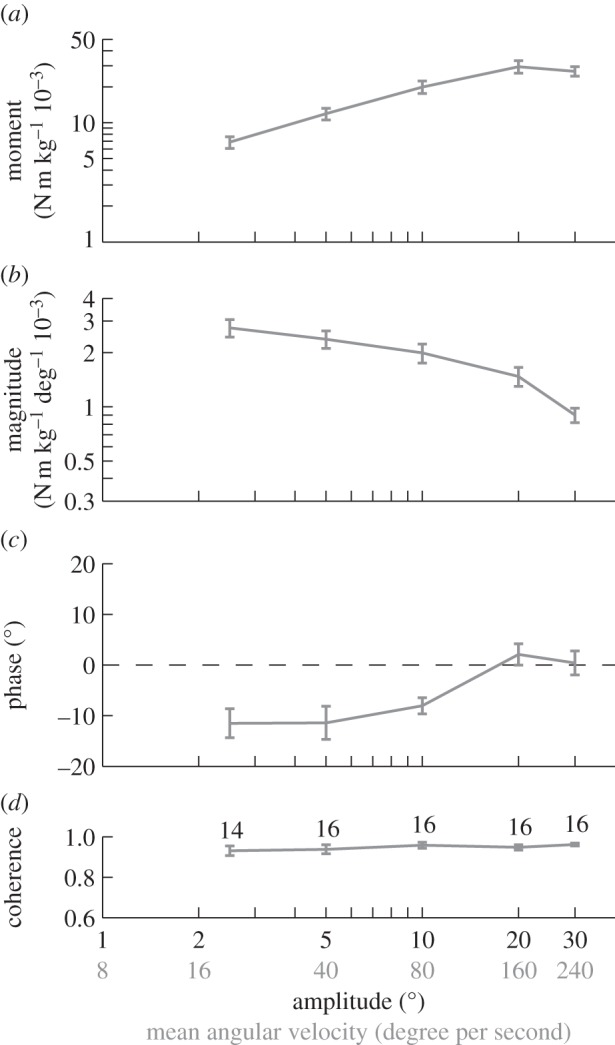
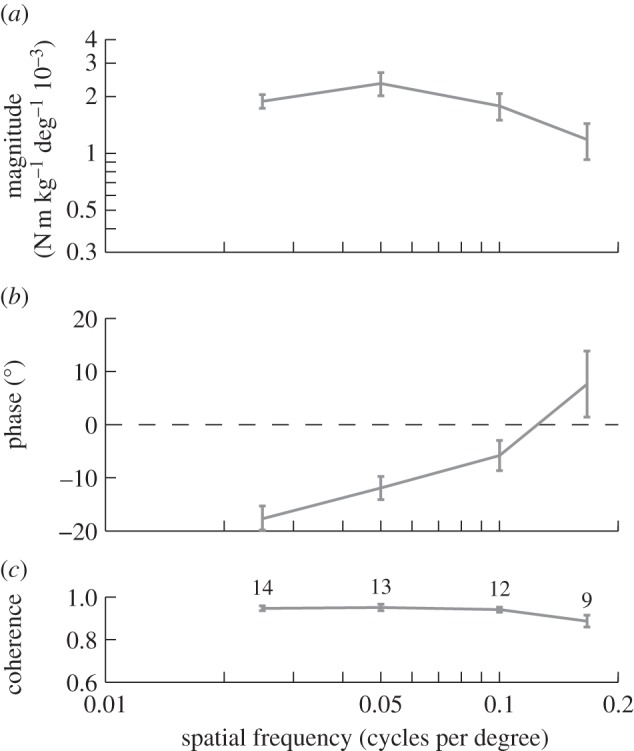
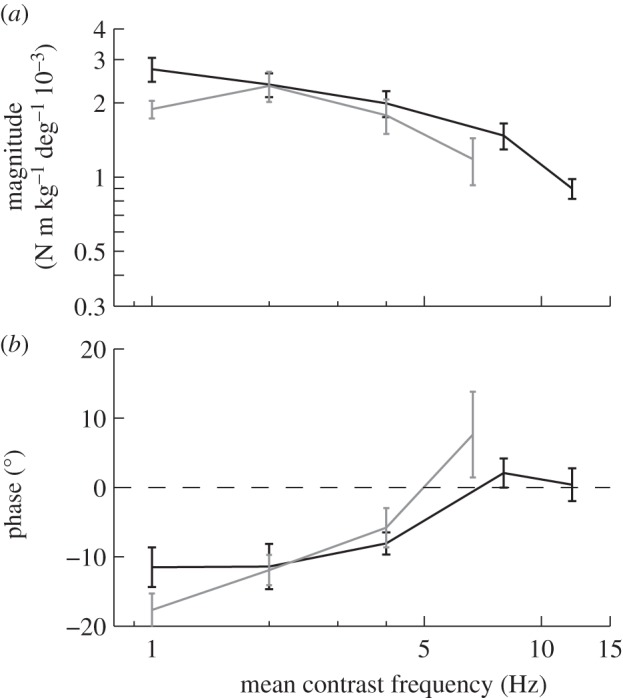
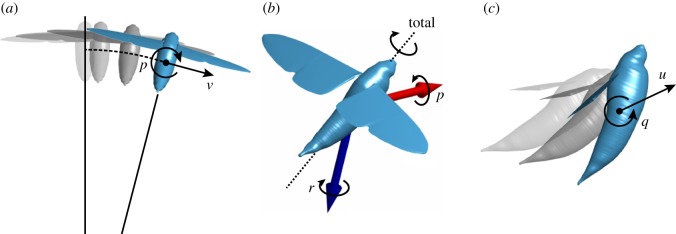
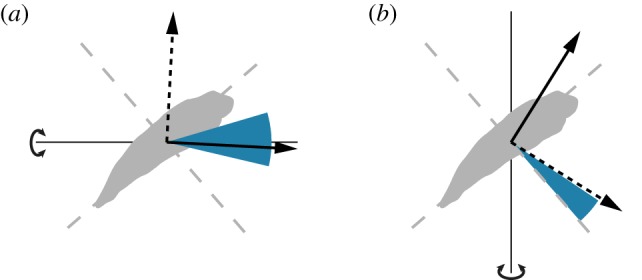
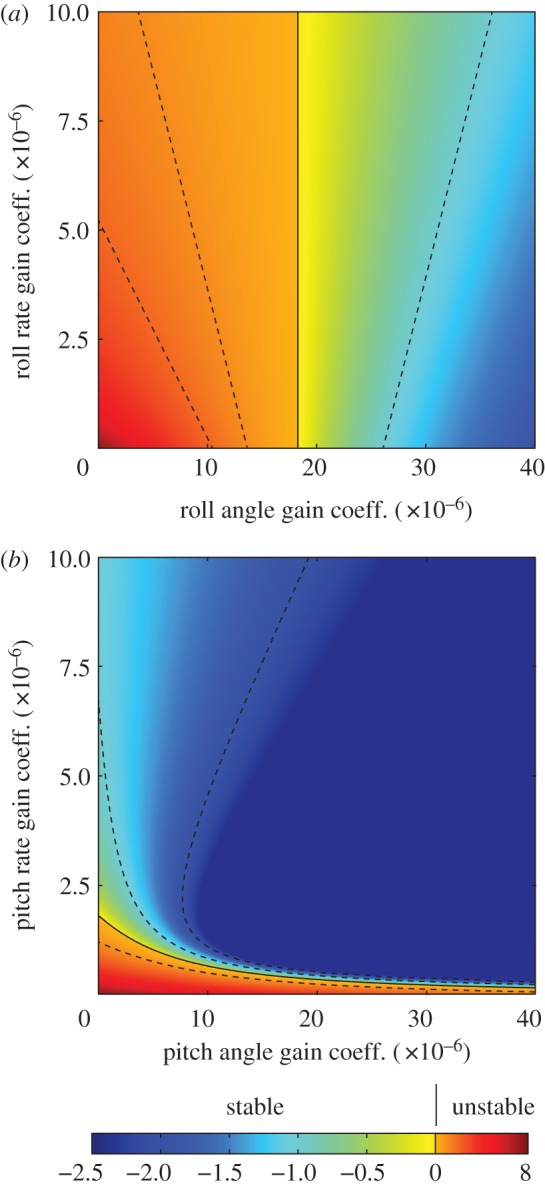
Vision is a key sensory modality for flying insects, playing an important role in guidance, navigation and control. Here, we use a virtual-reality flight simulator to measure the optomotor responses of the hawkmoth Hyles lineata, and use a published linear-time invariant model of the flight dynamics to interpret the function of the measured responses in flight stabilization and control. We recorded the forces and moments produced during oscillation of the visual field in roll, pitch and yaw, varying the temporal frequency, amplitude or spatial frequency of the stimulus. The moths' responses were strongly dependent upon contrast frequency, as expected if the optomotor system uses correlation-type motion detectors to sense self-motion. The flight dynamics model predicts that roll angle feedback is needed to stabilize the lateral dynamics, and that a combination of pitch angle and pitch rate feedback is most effective in stabilizing the longitudinal dynamics. The moths' responses to roll and pitch stimuli coincided qualitatively with these functional predictions. The moths produced coupled roll and yaw moments in response to yaw stimuli, which could help to reduce the energetic cost of correcting heading. Our results emphasize the close relationship between physics and physiology in the stabilization of insect flight.

Keywords: Hyles lineata; flight control; flight dynamics; hawkmoth; insect flight; optomotor.


Figures

Figure 1.
Figure 1.
Overview of the experimental set-up. (a) Diagram of the virtual-reality flight simulator. Wide-field visual stimuli were provided by two modified data projectors (1,2) projecting via a system of mirrors (3,4), onto a hollow acrylic sphere coated with rear-projection paint (5). (b) The moth was tethered at the centre of the sphere to a six-component force–moment balance (6). The body axis system shown in the figure (see main text for definitions) was used to resolve the measured forces and moments, and was also used to define the axis of the visual stimulus. The angular velocity components shown here indicate the direction of self-motion of the moth corresponding to a positively signed visual stimulus in roll, pitch or yaw. (c) Diagram of the spherical sinusoidal grating used as a visual stimulus. The rotation axis of the grating was aligned with either the roll, pitch or yaw axis.
Figure 2.
Figure 2.
Power and coherence of the responses of a single moth to roll stimuli oscillating at different temporal frequencies. Each coloured line represents a different stimulus trial. (a) Output power spectra of the roll moments generated by the moth. (b) Input power spectra of the angular position of the visual stimulus. (c) Coherence of the roll moment response relative to the angular position of the visual stimulus.
Figure 3.
Figure 3.
Measured responses to the stimulus set varying temporal frequency. Data points show means of the individual means ± 1 s.e. Blue, roll moment; red, yaw moment; green, pitch moment. (a–c) Response to roll stimuli. (d–f) Response to yaw stimuli. (g–i) Response to pitch stimuli. (a,d,g) Magnitude of the response relative to the angular position of the stimulus. (b,e,h) Phase of the response relative to the angle of the stimulus. (c,f,i) Coherence of the response. The numbers by each point indicate the number of moths that responded to that stimulus.
Figure 4.
Figure 4.
Orientation of the mean major axis of the response to roll and yaw stimuli in the stimulus set varying temporal frequency. (a–c) Roll and yaw moments plotted against each other for 1, 4 and 8 Hz roll stimuli, respectively. (d–f) Roll and yaw moments plotted against each other for 1, 4 and 8 Hz yaw stimuli, respectively. The elliptical orbits represent the path traced by the tip of the total moment vector, where the direction of the vector defines the axis about which the moment is produced and where the length of the vector represents the magnitude of the total moment. The dashed magenta line indicates the major axis of the ellipse, which we take to define the major axis of the response. If the roll and yaw components of the response are in phase, then the ellipse collapses to a straight line. The grey-shaded circles correspond to the stimulus phases marked in the inset. The outline of the moth's body is shown to illustrate the direction of the major axis of the response relative to the moth's body axes.
Figure 5.
Figure 5.
Roll moment response to the stimulus set varying oscillation amplitude. Data points show means of the individual means ± 1 s.e. (a) Roll moment normalized by body mass. (b) Magnitude of the roll moment relative to the angular position of the stimulus. (c) Phase of the response relative to the angle of the stimulus. (d) Coherence of the response. The numbers by each point indicate the number of moths that responded to that stimulus.
Figure 6.
Figure 6.
Roll moment response to the stimulus set varying spatial frequency. Data points show means of the individual means ± 1 s.e. (a) Magnitude of the roll moment relative to the angular position of the stimulus. (b) Phase of the response relative to the angle of the stimulus. (c) Coherence of the response. The numbers by each point indicate the number of moths that responded to that stimulus. No moth responded coherently to the stimulus with 0.333 cycles per degree spatial frequency.
Figure 7.
Figure 7.
Roll moment response to the stimulus sets varying spatial frequency (grey lines) and oscillation amplitude (black lines), plotted as a function of contrast frequency. Data points show means of the individual means ± 1 s.e. (a) Magnitude of the roll moment relative to the angular position of the stimulus. (b) Phase of the response relative to the angle of the stimulus.
Figure 8.
Figure 8.
Diagrams illustrating three of the natural modes of motion that the theoretical flight dynamics model predicts. Animations accompany each of these figures as movies S1–S3 in the electronic supplementary material. (a) The roll divergence mode involves a slow, monotonic divergence in roll rate (p) and sideslip (v). In this mode, the moth's centre of mass effectively moves with increasing angular velocity along an arc of radius 0.1 m (dashed line). (b) The fast subsidence mode involves a fast, monotonic subsidence in roll and yaw. In this mode, roll rate (p) and yaw rate (r) have similar magnitude but opposite sign, so the mode involves heavily damped rotation about an axis close to the body's long axis (dashed line). (c) The unstable phugoid mode involves coupled oscillations in fore–aft velocity (u) and pitch rate (q). The grey outlines represent past states of the moth.
Figure 9.
Figure 9.
Directions of the major axes of the moths’ response to roll and yaw stimuli, compared with the direction of the moment that is predicted to transfer maximum or minimum energy into a given mode of motion. The stimulus axis is shown as a thin black line with a curved arrow, and the range of the major axes of the responses across all stimulus frequencies is shown by the blue-shaded wedge. The principal axes of inertia of the moth are marked with dashed grey lines. The axes about which applied moments would theoretically contribute maximum or minimum energy to a given natural mode of motion are indicated with solid and dashed black vectors, respectively. (a) Variation in the major axis of the measured response to roll stimuli compared with the direction of the moment that transfers maximum or minimum energy into the roll divergence mode. (b) Variation in the major axis of the measured response to yaw stimuli compared with the direction of the moment that transfers maximum or minimum energy into the fast subsidence mode.
Figure 10.
Figure 10.
Eigenvalue plots showing how feedback control is predicted to affect the stability of the two modes of motion requiring active stabilization. (a) Closed-loop stability of the roll divergence mode, assuming proportional feedback of roll angle and/or roll rate to command a moment offset 3° below the roll axis. Moments applied about this axis contribute maximum energy to this mode, and therefore best control it. (b) Closed-loop stability of the unstable phugoid mode, assuming proportional feedback of pitch angle and/or pitch rate to command a moment about the pitch axis. The colour of the plot represents the real part of the corresponding eigenvalue, where a positive real part indicates an unstable mode, and where a negative real part indicates a stable mode. Dashed lines are contour lines, and the solid contour indicates the threshold between stability and instability. Note the difference in the scale of the colour bar for positive (i.e. unstable) and negative (i.e. stable) eigenvalues. See the electronic supplementary material for explanation of the gain coefficients.

References

    1. Tanaka K, Kawachi K. 2006. Response characteristics of visual altitude control system in Bombus terrestris. J. Exp. Biol. 209, 4533–4545. (10.1242/jeb.02552) - DOI - PubMed
    1. Fry SN, Rohrseitz N, Straw AD, Dickinson MH. 2009. Visual control of flight speed in Drosophila melanogaster. J. Exp. Biol. 212, 1120–1130. (10.1242/jeb.020768) - DOI - PubMed
    1. Graetzel CF, Nelson BJ, Fry SN. 2010. Frequency response of lift control in Drosophila. J. R. Soc. Interface 7, 1603–1616. (10.1098/rsif.2010.0040) - DOI - PMC - PubMed
    1. Straw AD, Lee S, Dickinson MH. 2010. Visual control of altitude in flying Drosophila. Curr. Biol. 20, 1550–1556. (10.1016/j.cub.2010.07.025) - DOI - PubMed
    1. Theobald JC, Ringach DL, Frye MA. 2010. Dynamics of optomotor responses in Drosophila to perturbations in optic flow. J. Exp. Biol. 213, 1366–1375. (10.1242/jeb.037945) - DOI - PMC - PubMed

Publication types

LinkOut - more resources