. 2014 Apr;8(4):841-53.
doi: 10.1038/ismej.2013.219. Epub 2013 Dec 12.

Distinct microbial communities associated with buried soils in the Siberian tundra

Affiliations

Distinct microbial communities associated with buried soils in the Siberian tundra

Antje Gittel et al. ISME J. 2014 Apr.

Abstract

Cryoturbation, the burial of topsoil material into deeper soil horizons by repeated freeze-thaw events, is an important storage mechanism for soil organic matter (SOM) in permafrost-affected soils. Besides abiotic conditions, microbial community structure and the accessibility of SOM to the decomposer community are hypothesized to control SOM decomposition and thus have a crucial role in SOM accumulation in buried soils. We surveyed the microbial community structure in cryoturbated soils from nine soil profiles in the northeastern Siberian tundra using high-throughput sequencing and quantification of bacterial, archaeal and fungal marker genes. We found that bacterial abundances in buried topsoils were as high as in unburied topsoils. In contrast, fungal abundances decreased with depth and were significantly lower in buried than in unburied topsoils resulting in remarkably low fungal to bacterial ratios in buried topsoils. Fungal community profiling revealed an associated decrease in presumably ectomycorrhizal (ECM) fungi. The abiotic conditions (low to subzero temperatures, anoxia) and the reduced abundance of fungi likely provide a niche for bacterial, facultative anaerobic decomposers of SOM such as members of the Actinobacteria, which were found in significantly higher relative abundances in buried than in unburied topsoils. Our study expands the knowledge on the microbial community structure in soils of Northern latitude permafrost regions, and attributes the delayed decomposition of SOM in buried soils to specific microbial taxa, and particularly to a decrease in abundance and activity of ECM fungi, and to the extent to which bacterial decomposers are able to act as their functional substitutes.


Figures

Figure 1
Figure 1
Schematic drawings of one representative soil pit profile for each vegetation type (shrubby grass tundra: pit C, shrubby tussock tundra: pit D and shrubby lichen tundra: pit I). O, Oe, Oa, OA, A, AB: topsoil, BCg, Cg: subsoil. Ajj: buried topsoils, PF: permafrost (depth in cm below surface indicated in brackets). Location of buried topsoils (Ajj) is indicated and labeled with the corresponding sample ID. If sample IDs are missing, location of the soil sample was only reported in the soil pit description, but not included in the drawings. Bar charts show abundances of Bacteria and Fungi as bacterial and fungal SSU gene copy numbers g−1 dry soil (logarithmic scale). Supplementary Figures S3A–C provide information on SSU rRNA gene quantifications for all nine soil pits (three replicates per vegetation type, including the ones presented in this figure).
Figure 2
Figure 2
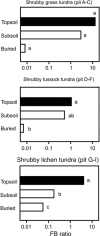
Fungal–bacterial (FB) ratios for the three different sampling sites as calculated from bacterial and fungal SSU rRNA gene copies g−1 dry soil. Small letters indicate significant differences between soil horizons as determined by one-way ANOVA and Tukey's HSD test.
Figure 3
Figure 3
Prokaryotic (a) and fungal (b) community structure shown as relative abundance on phylum level and based on SSU rRNA gene Illumina tag sequencing and fungal ITS pyrosequencing, respectively. ‘Others' include phyla with <0.5% relative abundance (see Supplementary Tables S2 and S3 in the supplementary for detailed information). Number of samples analyzed given in brackets.
Figure 4
Figure 4
Overview of total sequences, number of OTUs, and microbial diversity topsoils, subsoils, buried topsoils and permafrost samples. Microbial diversity indicated by Chao1 richness, Shannon diversity and Faith's phylogenetic diversity (PD). Calculation of richness and diversity estimators was based on OUT tables rarified to the same sequencing depth (that is, the lowest one of total sequencing reads). Total sequences refer to the total number of taxonomically assigned sequences (see Material and Methods for details). OTUs were defined as <3% nucleotide sequence difference.
Figure 5
Figure 5
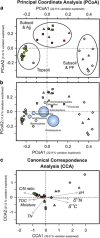
Phylogenetic dissimilarity between soil samples. Topsoils: green circles, subsoils: yellow triangles, buried topsoils: red squares, permafrost: white diamonds. See Supplementary Table S2 in the supplementary for detailed information on samples analyzed. (a) Principal coordinate analysis plot illustrating unweighted UniFrac distances between bacterial communities in individual samples. (b) The coordinates of the eight most abundant taxa are plotted as a weighted average of the coordinates of all samples, where the weights are the relative abundances of the taxon in the samples. The size of the sphere representing a taxon is proportional to the mean relative abundance of the taxon across all samples. (c) CCA plot for the first two dimensions to show the relationship between prokaryotic community structure (relative abundance of bacterial and archaeal OTUs) and environmental parameters. Correlations between environmental variables and CCA axes are represented by the length and angle of arrows (environmental factor vectors).
Figure 6
Figure 6
CCA ordination plots for the first two dimensions to show the relationship between fungal community structure (relative abundance of fungal OTUs) and environmental parameters. Topsoils: green circles, subsoils: yellow triangles, buried topsoils: red squares. See Supplementary Table S3 in the supplementary for detailed information on samples analyzed. Correlations between environmental variables and CCA axes are represented by the length and angle of arrows (environmental factor vectors).

References

    1. Abarenkov K, Henrik Nilsson R, Larsson K-H, Alexander IJ, Eberhardt U, Erland S, et al. The UNITE database for molecular identification of fungi—recent updates and future perspectives. New Phytol. 2010;186:281–285. - PubMed
    1. Aitchison J. The statistical analysis of compositional data. J R Stat Soc Ser B (Methodol) 1982;44:139–177.
    1. Allison SD. Cheaters, diffusion and nutrients constrain decomposition by microbial enzymes in spatially structured environments. Ecol Lett. 2005;8:626–635.
    1. Ausec L, Zakrzewski M, Goesmann A, Schlüter A, Mandic-Mulec I. Bioinformatic analysis reveals high diversity of bacterial genes for laccase-like enzymes. PLoS One. 2011;6:e25724. - PMC - PubMed
    1. Bailey VL, Smith JL, Bolton H., Jr Fungal-to-bacterial ratios in soils investigated for enhanced C sequestration. Soil Bio Biochem. 2002;34:997–1007.

Publication types