. 2013 Dec 10;5(4):1691-738.
doi: 10.3390/cancers5041691.

Circulating Tumor Cell Detection and Capture by Photoacoustic Flow Cytometry in Vivo and ex Vivo

Affiliations

Circulating Tumor Cell Detection and Capture by Photoacoustic Flow Cytometry in Vivo and ex Vivo

Ekaterina I Galanzha et al. Cancers (Basel). .

Abstract

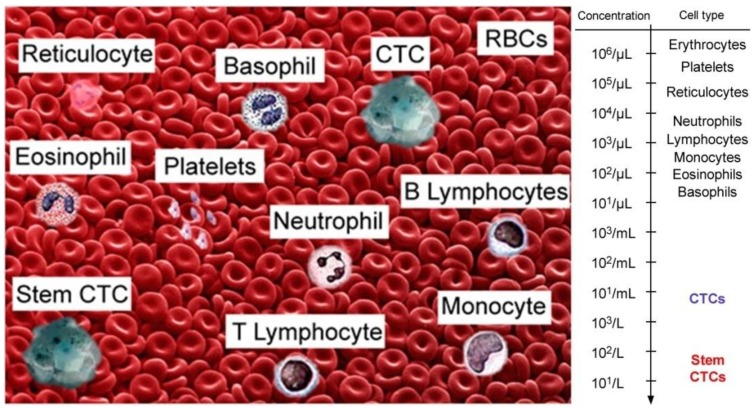
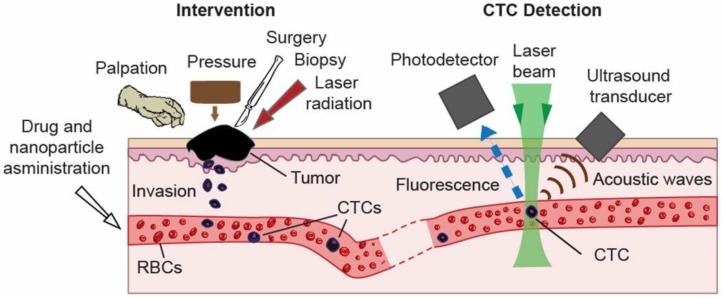
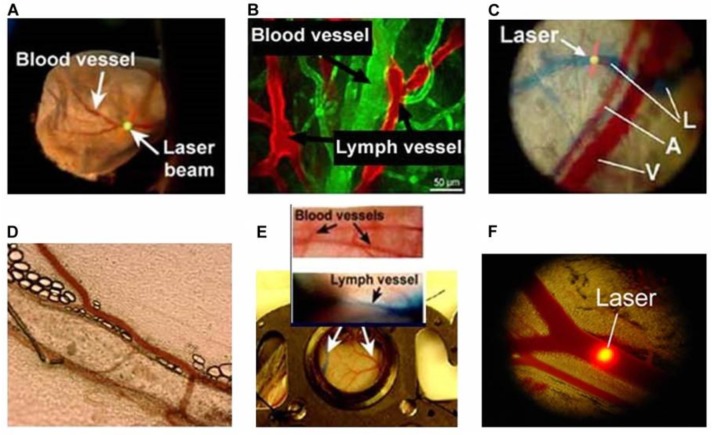
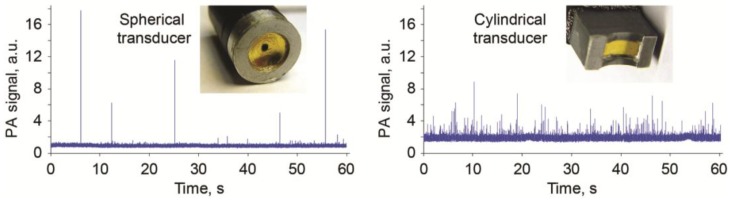
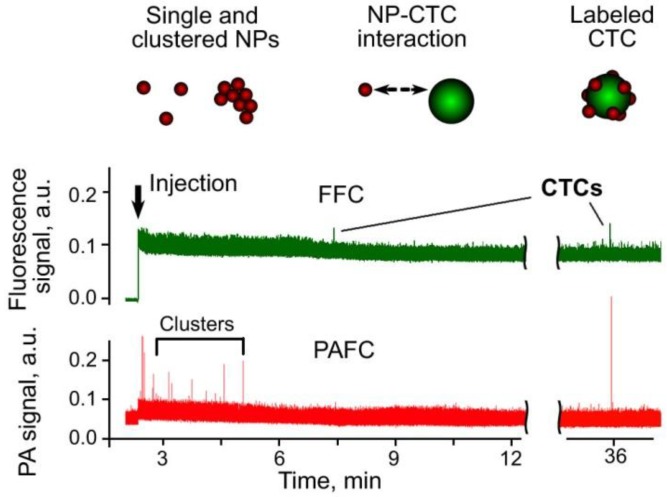
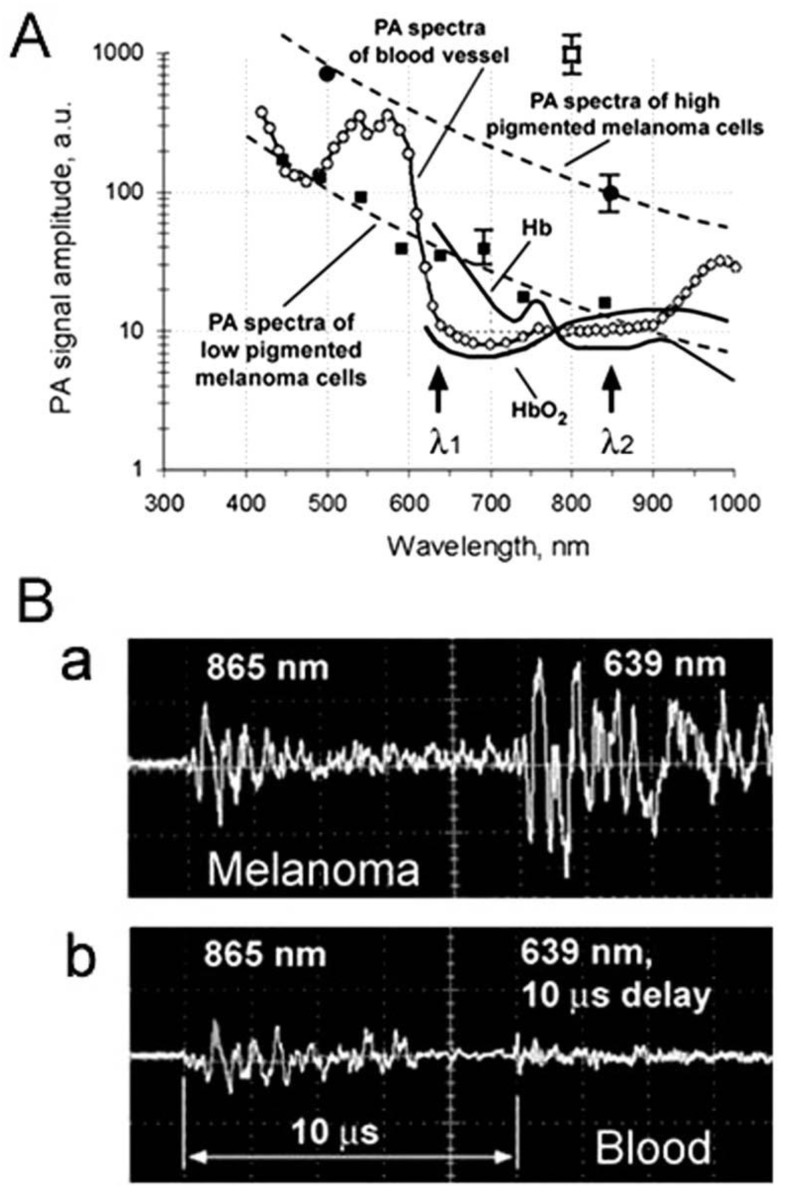
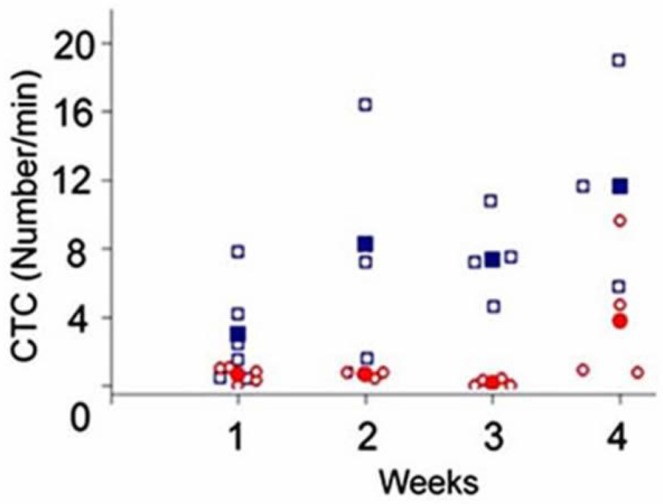
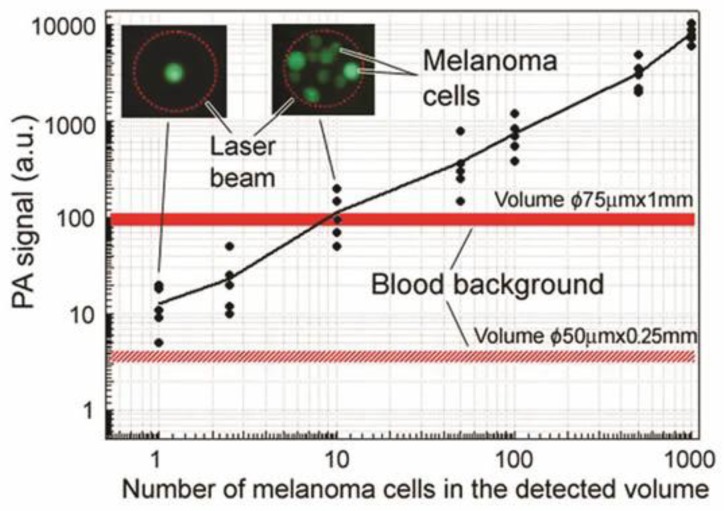
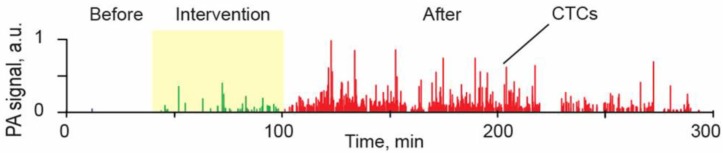
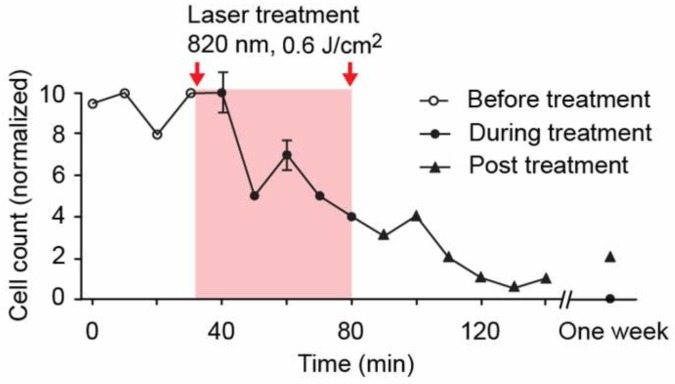
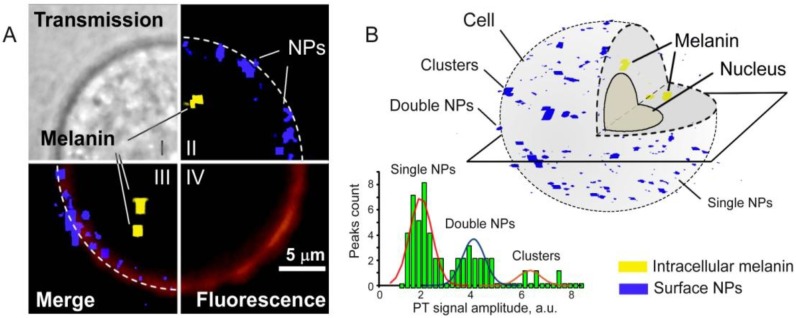
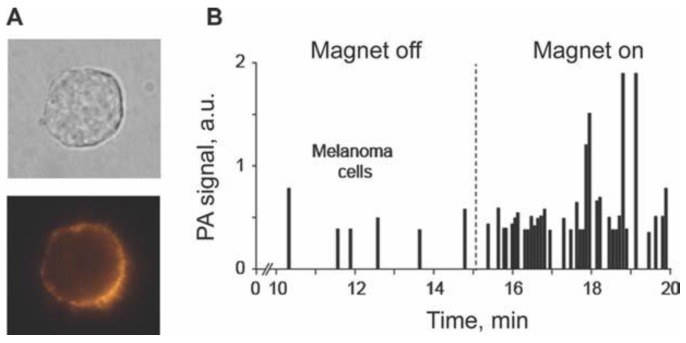
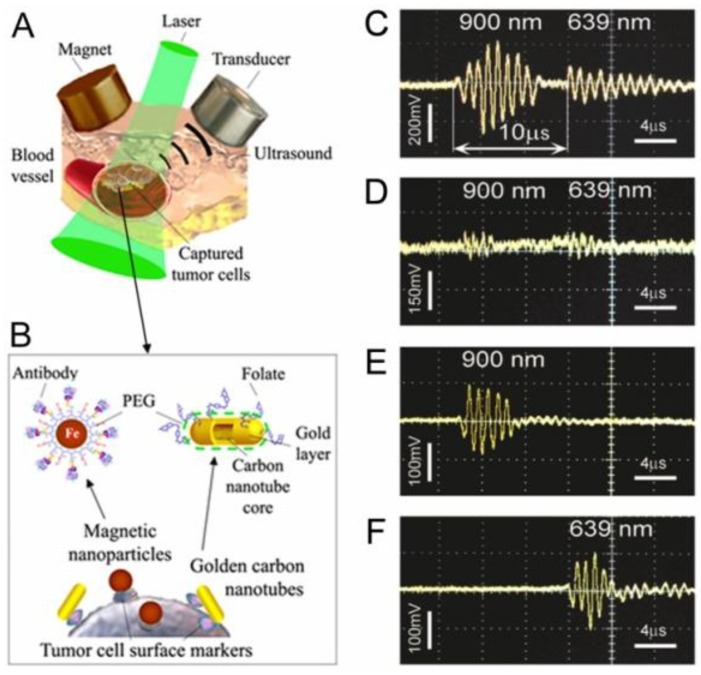
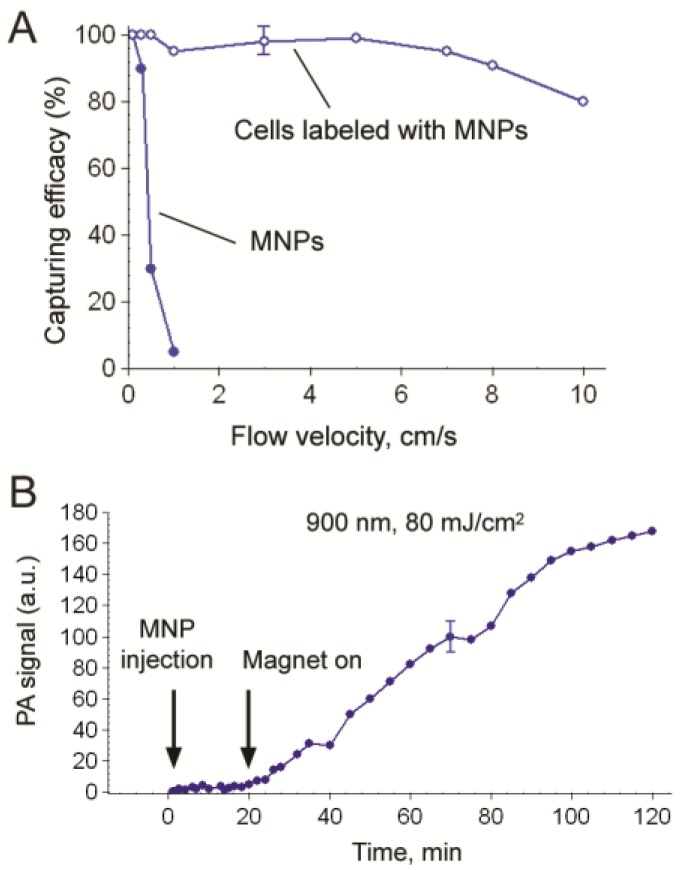
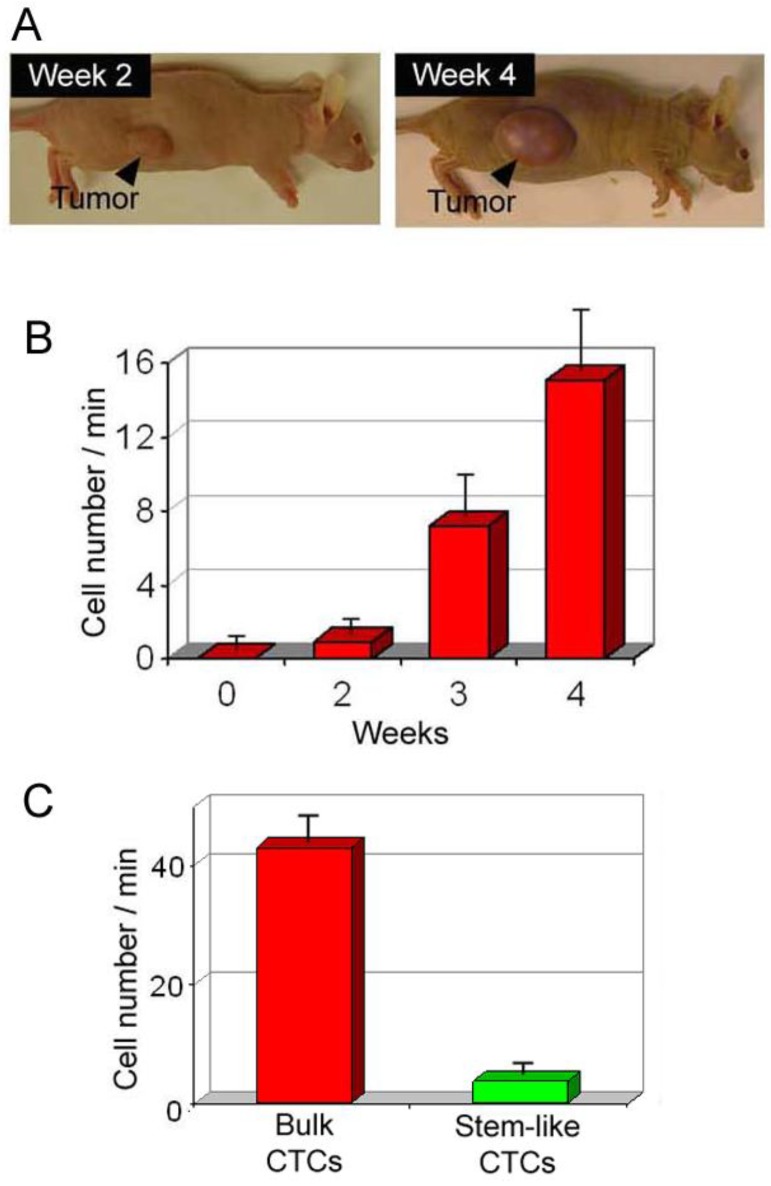
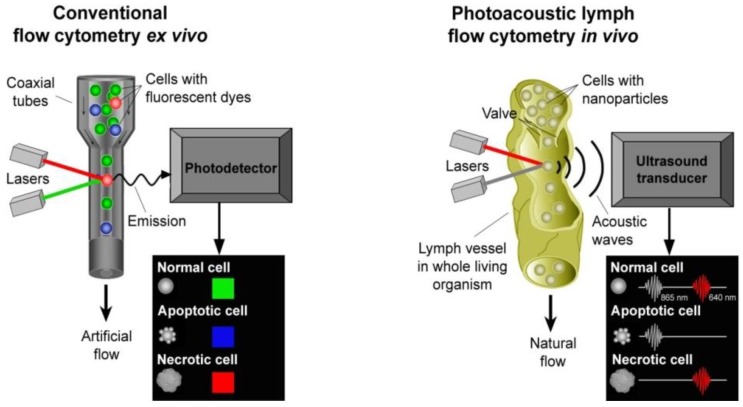
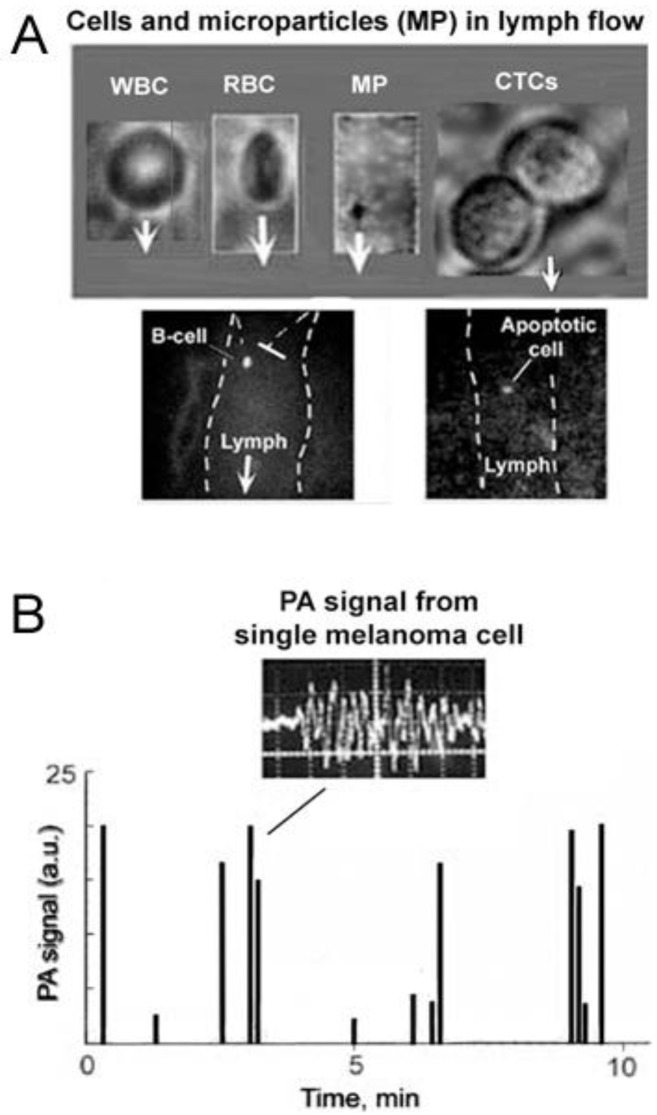
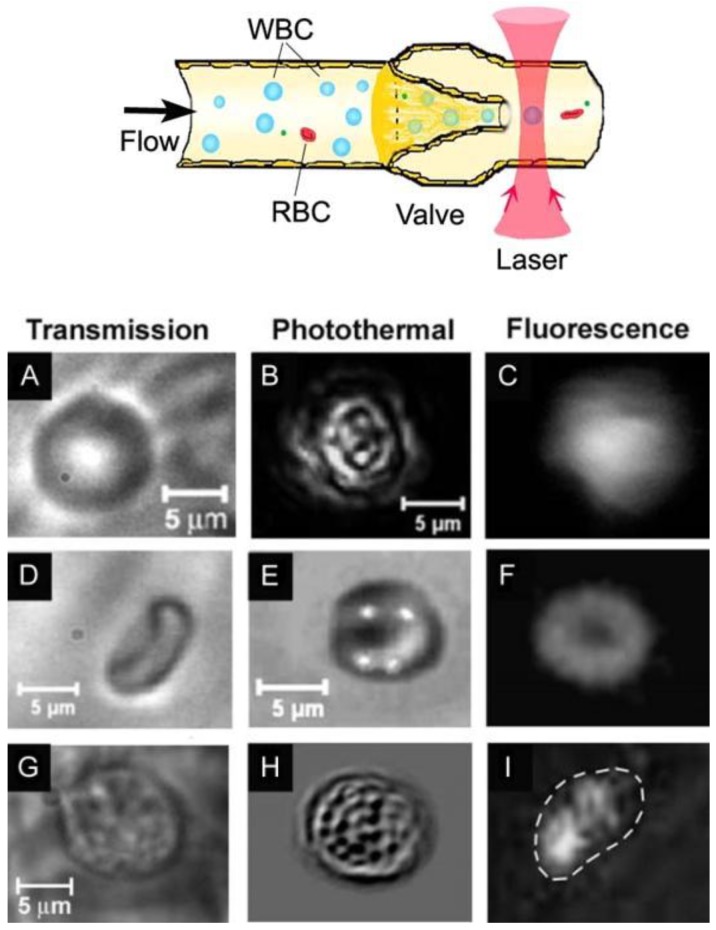
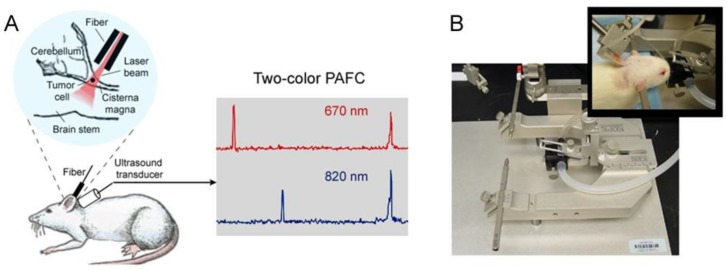
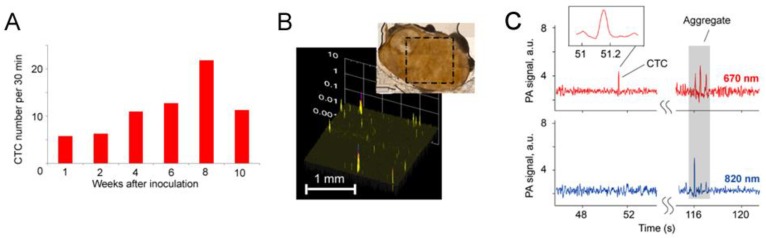
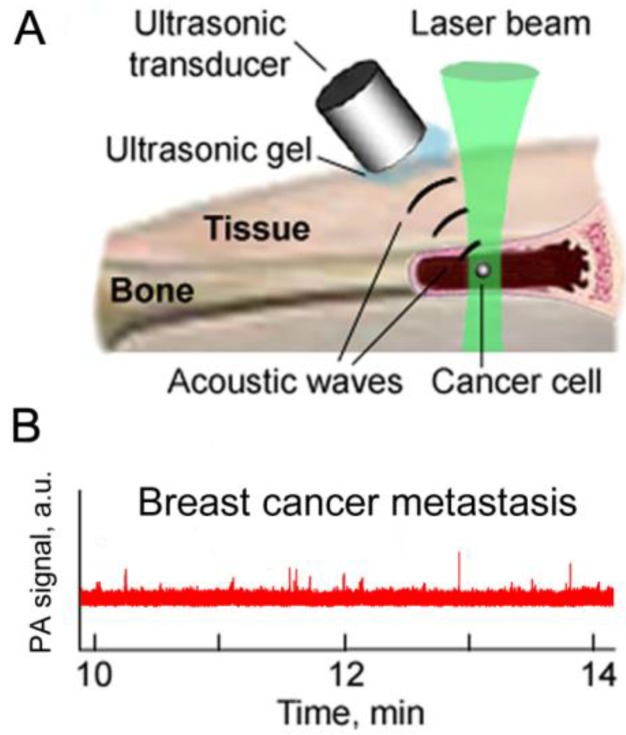
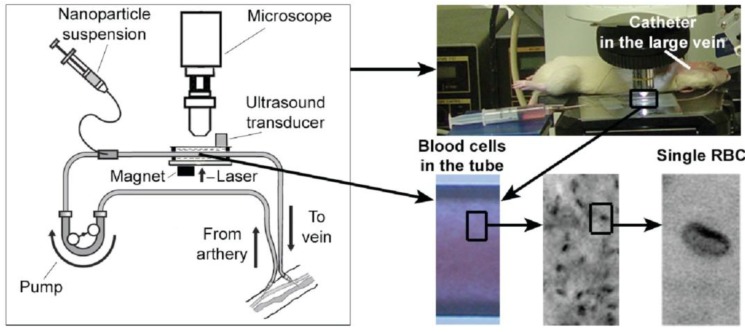
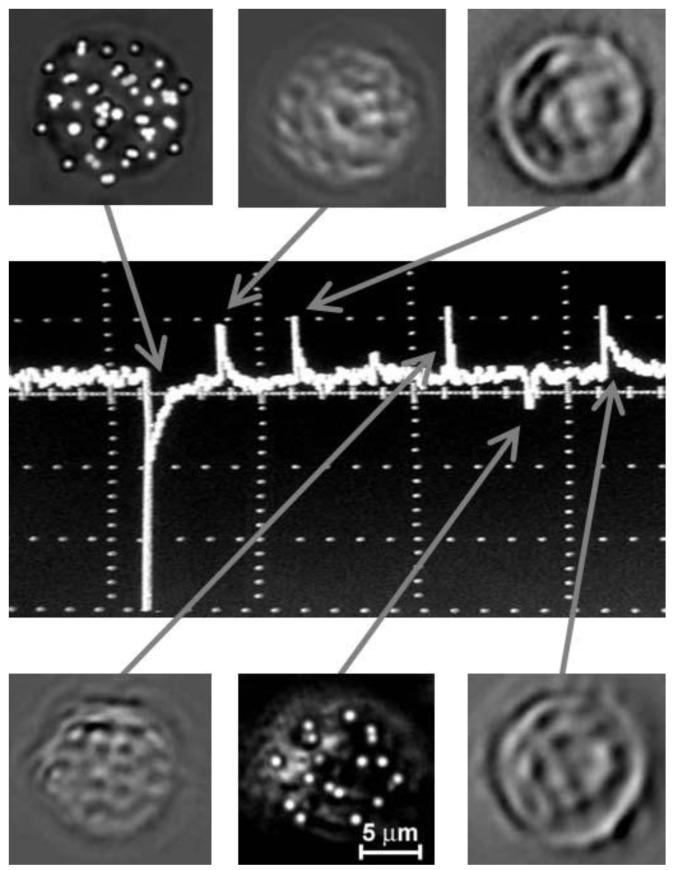
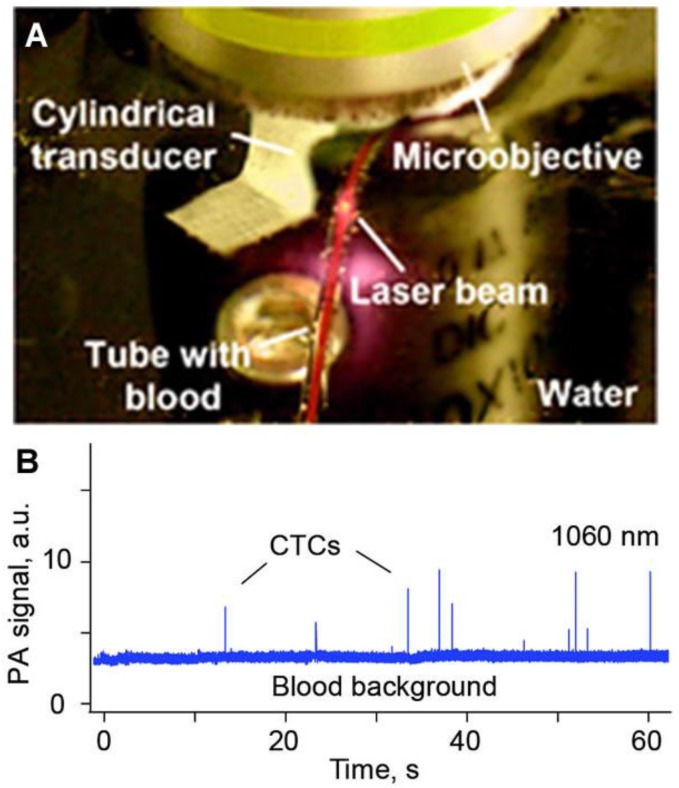
Despite progress in detecting circulating tumor cells (CTCs), existing assays still have low sensitivity (1-10 CTC/mL) due to the small volume of blood samples (5-10 mL). Consequently, they can miss up to 103-104 CTCs, resulting in the development of barely treatable metastasis. Here we analyze a new concept of in vivo CTC detection with enhanced sensitivity (up to 102-103 times) by the examination of the entire blood volume in vivo (5 L in adults). We focus on in vivo photoacoustic (PA) flow cytometry (PAFC) of CTCs using label-free or targeted detection, photoswitchable nanoparticles with ultrasharp PA resonances, magnetic trapping with fiber-magnetic-PA probes, optical clearance, real-time spectral identification, nonlinear signal amplification, and the integration with PAFC in vitro. We demonstrate PAFC's capability to detect rare leukemia, squamous carcinoma, melanoma, and bulk and stem breast CTCs and its clusters in preclinical animal models in blood, lymph, bone, and cerebrospinal fluid, as well as the release of CTCs from primary tumors triggered by palpation, biopsy or surgery, increasing the risk of metastasis. CTC lifetime as a balance between intravasation and extravasation rates was in the range of 0.5-4 h depending on a CTC metastatic potential. We introduced theranostics of CTCs as an integration of nanobubble-enhanced PA diagnosis, photothermal therapy, and feedback through CTC counting. In vivo data were verified with in vitro PAFC demonstrating a higher sensitivity (1 CTC/40 mL) and throughput (up to 10 mL/min) than conventional assays. Further developments include detection of circulating cancer-associated microparticles, and super-rsesolution PAFC beyond the diffraction and spectral limits.


Figures

Figure 1
Figure 1
Typical blood composition and concentration levels of bulk and stem CTCs in blood cells.
Figure 2
Figure 2
Schematic of integrated in vivo flow cytometry (FC). (Right) PA and fluorescence detection of CTCs with absorption or/and fluorescence properties; (Left) Natural and enforced CTC release in circulation from a primary tumor or metastasis during diagnostic and therapeutic interventions [28,29].
Figure 3
Figure 3
(A) Photo of nude mouse ear; (B) Fluorescence images of mouse ear vasculature; (C) Optical (transmission) image of mouse ear: A, arterial; V, vein; L, Evans blue-labeled lymph vessels; (D) Optical images of lymph and blood microvessels of rat mesentery; (E) Window chamber in the skin of a murine model; (F) Circular laser beam on a blood vessel [50,51,52].
Figure 4
Figure 4
PA signal traces from melanoma cells (B16F10) in mouse blood with focused spherical (left) and cylindrical (right) ultrasound transducers with focal lengths of 6 mm and lateral resolution of ~60 µm. These data were obtained by Y. Menyaev.
Figure 5
Figure 5
Nonlinear PA signal amplification at 820 nm in melanoma cells (B16F10) with different pigmentation under static (A) and flow (B) conditions as a function of the laser energy fluences [102].
Figure 6
Figure 6
Optical imaging of the microanatomy of a fresh lymph node ex vivo obtained with optical clearance using 80% glycerol. The central schematic shows a midsagittal section of a lymph node containing three lymphoid lobules with the basic anatomical and functional unit of the lymph node. Top and middle lobules: microanatomical schematics of lobular compartments (superficial cortex, deep cortex, and medulla) without (top) and with (middle) reticular meshwork. Bottom lobule: a lobule of a mouse lymph node as it appears in conventional histological section. C1 shows basophilic lymphocytes; C2 shows elongated fibroblastic reticular cells; and C3 shows B lymphocytes and follicular dendritic cells [83].
Figure 7
Figure 7
Laser beam after passing through 0.9 mm-thick layer of fresh mouse skin (top) and PA signals from a 1 mm-diameter, 1.3 mm vein (bottom) before (left) and after (right) optical clearance [70].
Figure 8
Figure 8
Minimally invasive fiber delivery of laser radiation into blood vessels with detection of acoustic waves by an ultrasound transducer on the skin surface.
Figure 9
Figure 9
In vivo multimodal PA (red trace) and fluorescence (green trace) detection of CTCs (C8161-GFP) in a tumor-bearing mouse model with functionalized MNPs and GFP as PA and fluorescent contrast agents, respectively. Black arrow marks the moment of NP injection. Wavelength and energy fluence/intensity for PAFC and FFC: 820 nm and 50 mJ/cm2 and 488 nm and 80 W/cm2, respectively.
Figure 10
Figure 10
(A) PA spectra of ~50 μm diameter veins in mouse ear (empty circles); the average standard deviation for each wavelength is 20%. The absorption spectra of the B16F10 cells (dashed curves) were normalized to PA signals from single melanoma cells with strong (black circle) and weak (dark square) pigmentation; open square indicates signal from melanoma cell with GNRs; fragment of solid curves shows absorption for 100% of hemoglobin and oxyhemoglobin; (B) Real-time two-color PAFC (λ1 = 639 nm; λ2 = 865 nm) to identify melanoma CTCs among RBCs.
Figure 11
Figure 11
Average melanoma CTC rate in 150 µm-diameter skin vessels as a function of time after B16F10 cell inoculation in the ear (red open circle) and skin (blue open square); filled red circle and filled blue square, averaged data (905 nm, 30 mJ/cm2).
Figure 12
Figure 12
PA signals from human blood samples with different numbers of melanoma cells in the detection volume (850 nm, 150 mJ/cm2).
Figure 13
Figure 13
Typical PA signal trace produced by melanoma CTCs (B16F10-GFP) in microvessels of the mouse ear before, during, and after application of 120 g pressure on an ~5 mm-diameter skin tumor [28,29].
Figure 14
Figure 14
Theranostic of melanoma CTCs integrating PA detection, PT killing, and PA assessment of therapeutic efficacy through a decrease in the CTC count [28].
Figure 15
Figure 15
(A) Transmission (I), confocal PT at 532 nm (II), fluorescence (IV), and combined (III) images of SK-MEL-1 cells labeled with anti-MCSP MNPs and anti-MCSP-PE (dye); (B) 3-D distribution of surface MCSP receptors (blue) and intracellular melanin (yellow). These data were obtained by D. Nedosekin.
Figure 16
Figure 16
In vivo targeting of circulating SK-MEL-1 human melanoma cells in mouse blood. (A) MSCP expression by SK-MEL-1 cells, transmission (top) and fluorescence (bottom) images of a cell labeled with anti–human MSCP-Abs conjugated with PE fluorescent dye; (B) PAFC trace in tumor-bearing mouse model 10 min after CTC targeting by 50 nm MNPs conjugated with anti-human MSCP-Abs before and during magnet action. Laser wavelength, 1,064 nm; fluence, 100 mJ/cm2; pulse repetition rate, 10 kHz [90].
Figure 17
Figure 17
In vivo magnetic capture and two-color PA detection of breast CTCs. (A) Schematic showing the detection method. The laser beam is delivered either close to the external magnet or through a hole in the magnet with a fiber-based delivery system. (B) Schematic of targeting breast CTCs with MNPs (a 10 nm core, a 2 nm layer of amphiphilic triblock copolymers, and the ATF of the uPA and GNTs (12 nm × 98 nm) coated with PEG and folic acid. (CF) Typical PA signals at different wavelengths from CTCs labeled with MNPs and GNTs (C), GNTs only (D), and MNPs only (E). (F) PA signals from blood vessels only [81].
Figure 18
Figure 18
(A) Capturing efficiency for MNP-labeled cancer cells and free MNPs at different flow velocity of PBS in tube with diameter of 0.5 mm; (B) PA signals from CTCs in 200–300 µm abdominal mouse skin vessels obtained with fiber schematics at week one tumor development before and after magnet action [81].
Figure 19
Figure 19
PA detection of bulk and stem-like breast CTCs in tumor-bearing mice. (A) The size of the primary breast cancer xenografts at different stages of tumor development; (B) Average rate of bulk CTCs in mouse ear vein over a period of several weeks. (C) Average rate of CTCs associated with bulk folate+/uPAR+ CTCs and folateCD44+ stem-like CTCs in200 µm-diamater abdominal skin blood vessels in a mouse model of breast cancer (at week 4).
Figure 20
Figure 20
Comparison of conventional flow cytometry in vitro (left) and in vivo PA lymph flow cytometry (right) for detection of cells in different functional states.
Figure 21
Figure 21
In vivo lymph flow cytometry. (A) In vivo FC image with transmission and fluorescence techniques for identification of a WBC, an RBC, a microparticle (MP; likely chylomicron), CTCs, B lymphocytes, and apoptotic WBCs in lymph flow (magnification, 40×; image rate, 500–2,500 fps). (B) Application of label-free PAFC for detection of melanoma CTCs in an ear lymphatic in a preclinical animal model of metastatic melanoma (ear tumor in nude mice; week 2 after inoculation); insert: non-compressed time-resolved PA signal.
Figure 22
Figure 22
(Top) Schematic for the natural focusing of cells in lymph flow. (Bottom) transmission digital microscopy (TDM) (A,D,G), PT (B,E,H), and fluorescence (C,F,I) images of (top row) leukocytes, (middle row) RBCs, and (bottom row) K562 cancer cells in lymph flow in vivo.
Figure 23
Figure 23
Integrated technical platform for testing CSF in vivo and ex vivo. (A) Schematic of multicolor PAFC with the example of real-time two-color PAFC tracings from CSF; (B) The heating stereotaxic table for in vivo PAFC and CSF sampling.
Figure 24
Figure 24
In vivo multifluid PAFC of CTCs in blood, lymph, and CSF systems of breast tumor-bearing mice. (A) Dynamics of CTCs in blood circulation during tumor development measured by FFC; (B) PA scanning of the SLN; high-amplitude signals color-coded by yellow and red are associated with objects ≤15 μm; (C) Two-color (670 nm and 820 nm) PAFC of CSF in vivo through the skull.
Figure 25
Figure 25
In vivo PA bone flow cytometry. (A) Schematics; (B) Non-invasive in vivo molecular targeted detection of breast CTCs in mouse tibia.
Figure 26
Figure 26
Principle and animal model for in vivo PA detection, molecular targeting, magnetic capturing and PT ablation of CTCs in blood with an extracorporeal schematic.
Figure 27
Figure 27
Middle, Tracings of the PT signals (time scale, 200 ms/div) from leukemia cells. Top and bottom, Corresponding PT images. OPO parameters: wavelength, 530 nm; pulse rate, 100 Hz; fluence, 100 mJ/cm2 [75].
Figure 28
Figure 28
(A) In vitro PAFC with focused cylindrical transducer; (B) Typical PA signal trace from rare melanoma cells (B16F01) in 0.8 mm flow tube with mouse blood extracted from tumor-bearing mouse model [82]. Laser parameters: wavelength, 1,064 nm; pulse width 10 ns; pulse rate, 10 kHz; pulse energy, up 50 µJ; linear beam size, 5 µm × 1 mm. Customized ultrasound transducer parameters: type, focused cylindrical; frequency, 32 MHz; focal length, 8 mm; lateral resolution, 45 µm.

Similar articles

Cited by

References

    1. Kuo A.H., Clarke M.F. Identifying the metastatic seeds of breast cancer. Nat. Biotechnol. 2013;31:504–505. doi: 10.1038/nbt.2599. - DOI - PubMed
    1. Karakousis G., Yang R., Xu X. Circulating melanoma cells as a predictive biomarker. J. Invest. Dermatol. 2013;133:1460–1462. doi: 10.1038/jid.2013.34. - DOI - PubMed
    1. Alix-Panabieres C., Pantel K. Circulating tumor cells, liquid biopsy of cancer. Clin. Chem. 2013;59:110–118. doi: 10.1373/clinchem.2012.194258. - DOI - PubMed
    1. Joosse S.A., Pantel K. Biologic challenges in the detection of circulating tumor cells. Cancer Res. 2013;73:8–11. doi: 10.1158/0008-5472.CAN-12-3422. - DOI - PubMed
    1. Alix-Panabières C., Schwarzenbach H., Pantel K. Circulating tumor cells and circulating tumor DNA. Annu. Rev. Med. 2012;63:199–215. doi: 10.1146/annurev-med-062310-094219. - DOI - PubMed