. 2014 Aug;86(2):294-302.
doi: 10.1038/ki.2013.492. Epub 2013 Dec 11.

Fructokinase activity mediates dehydration-induced renal injury

Affiliations
Free PMC article

Fructokinase activity mediates dehydration-induced renal injury

Carlos A Roncal Jimenez et al. Kidney Int. 2014 Aug.
Free PMC article

Abstract

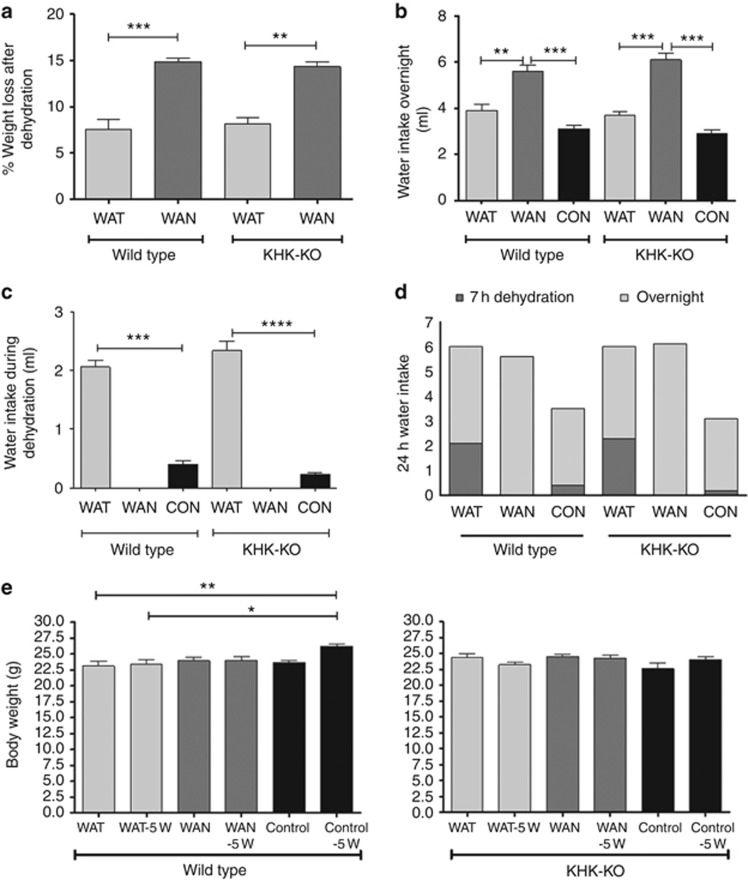
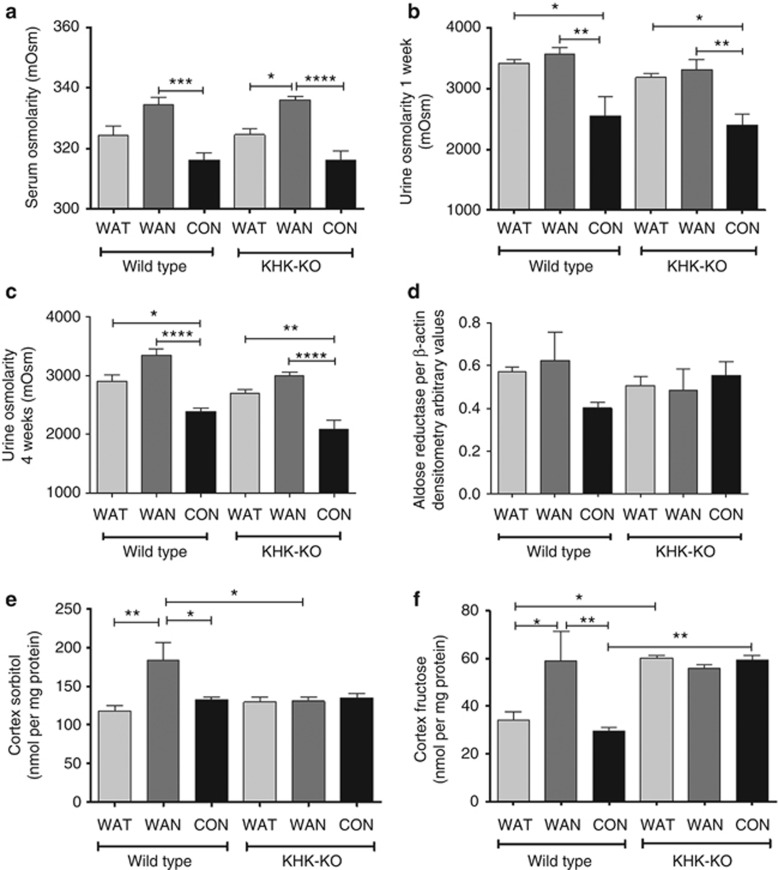
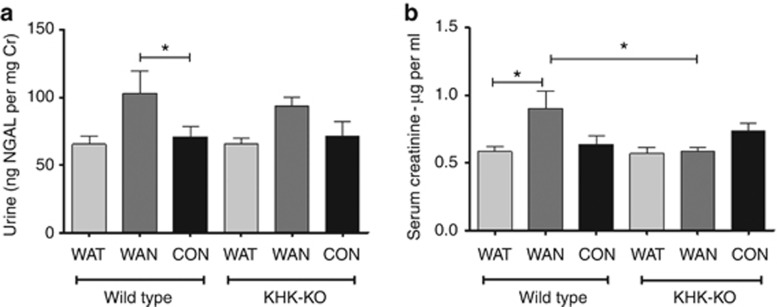
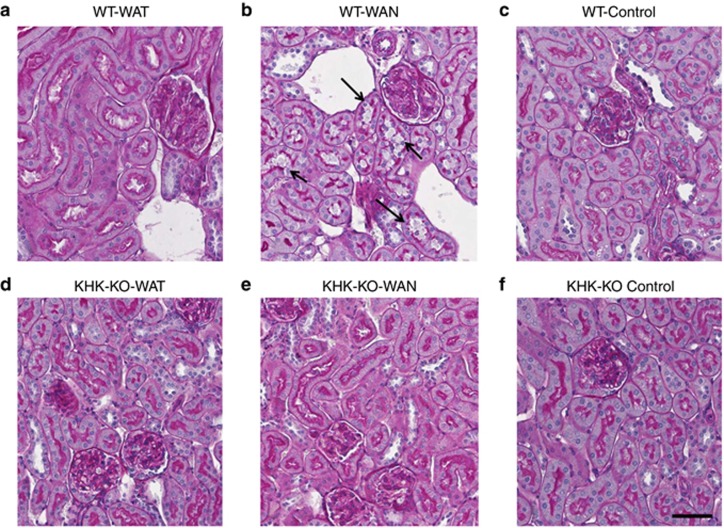
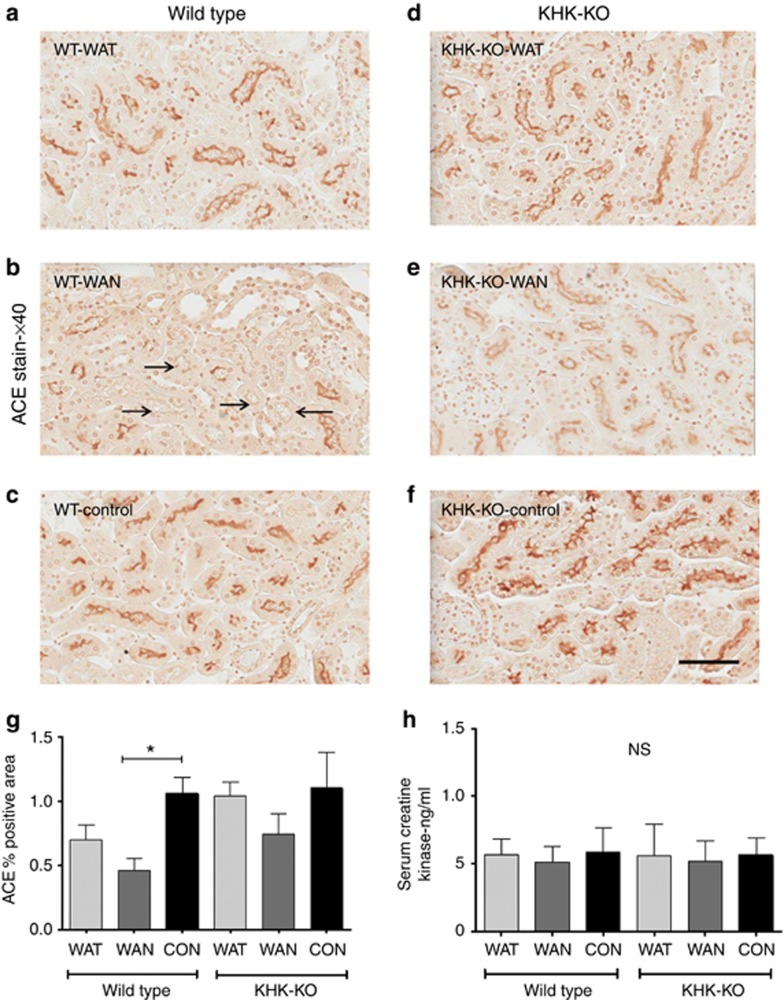
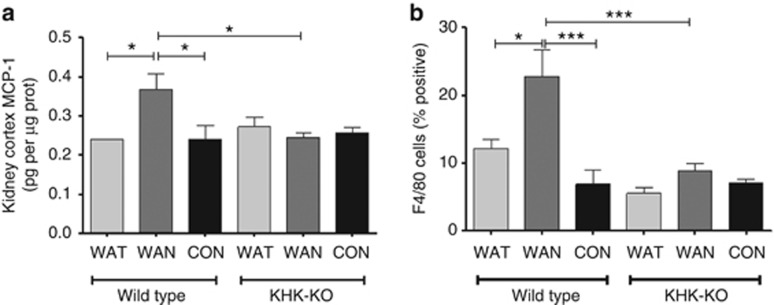
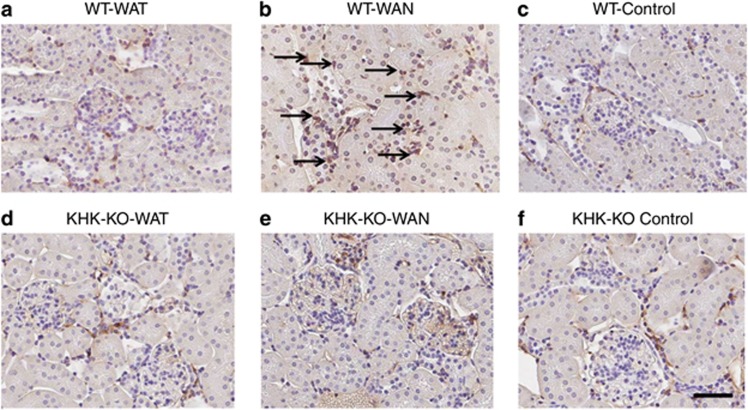
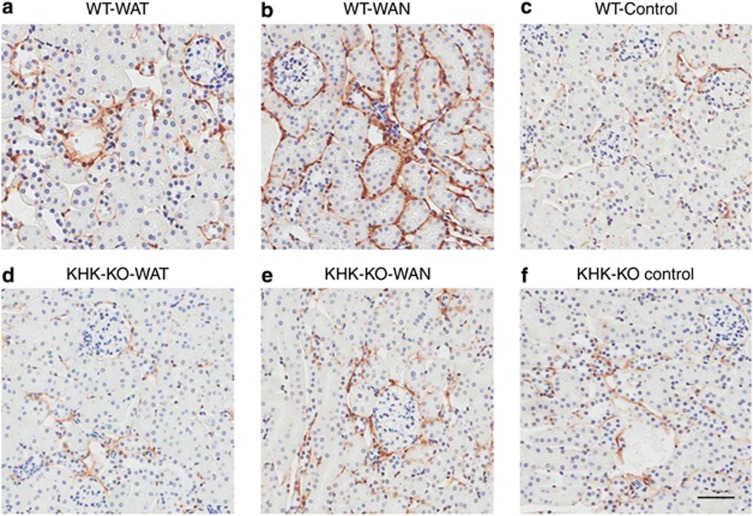
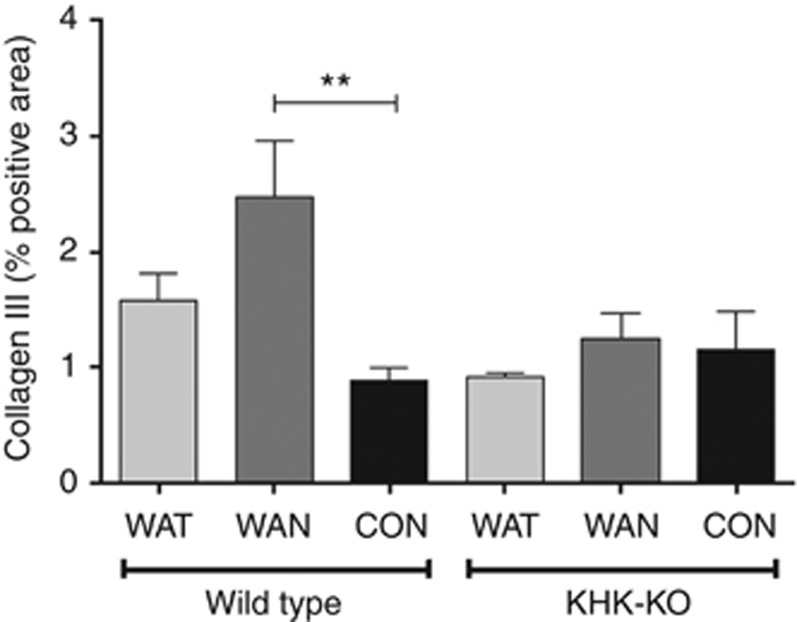
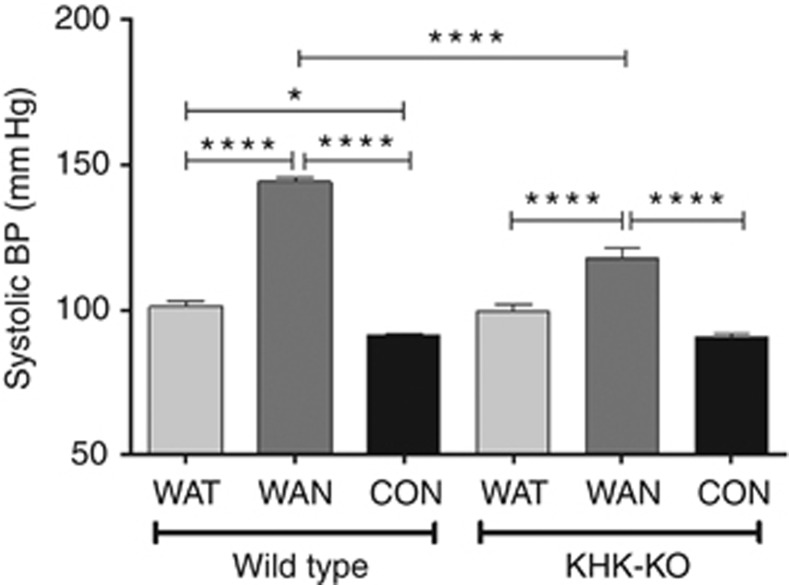
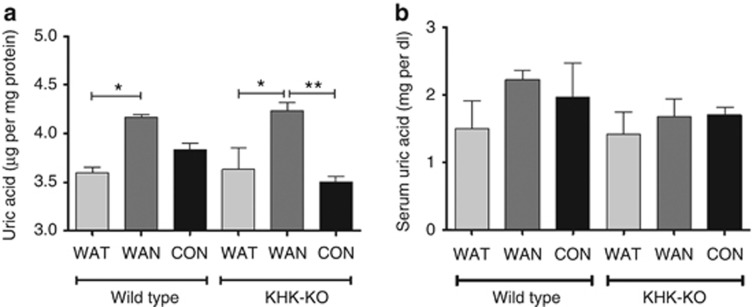
The epidemic of chronic kidney disease in Nicaragua (Mesoamerican nephropathy) has been linked with recurrent dehydration. Here we tested whether recurrent dehydration may cause renal injury by activation of the polyol pathway, resulting in the generation of endogenous fructose in the kidney that might subsequently induce renal injury via metabolism by fructokinase. Wild-type and fructokinase-deficient mice were subjected to recurrent heat-induced dehydration. One group of each genotype was provided water throughout the day and the other group was hydrated at night, after the dehydration. Both groups received the same total hydration in 24 h. Wild-type mice that received delayed hydration developed renal injury, with elevated serum creatinine, increased urinary NGAL, proximal tubular injury, and renal inflammation and fibrosis. This was associated with activation of the polyol pathway, with increased renal cortical sorbitol and fructose levels. Fructokinase-knockout mice with delayed hydration were protected from renal injury. Thus, recurrent dehydration can induce renal injury via a fructokinase-dependent mechanism, likely from the generation of endogenous fructose via the polyol pathway. Access to sufficient water during the dehydration period can protect mice from developing renal injury. These studies provide a potential mechanism for Mesoamerican nephropathy.


Figures

Figure 1
Figure 1
Effects of dehydration. (a) Percent weight loss after 7 h of dehydration. (b) Water intake overnight. (c) Water intake during dehydration. (d) The 24 h water intake (light shade, at night; dark shade, during dehydration). (e) Body weight at baseline and after 5 weeks. Data represent analysis of variance (ANOVA) (Bonferroni post test) *P<0.05; **P<0.01; ***P<0.001; ****P<0.0001. CON, control; KHK-KO, fructokinase knockout; WAN, water at night; WAT, water all time.
Figure 2
Figure 2
Dehydration activates the polyol pathway in the renal cortex. (a) Serum osmolarity at the end of the 7 h dehydration period. Urinary osmolarity after week 1 (b) and week 4 (c). (d) Renal cortical aldose reductase protein level (densitometry of western blot). (e) Renal cortex sorbitol levels. (f) Renal cortex fructose levels. Data represent analysis of variance (ANOVA) (Bonferroni post test) *P<0.05; **P<0.01; ***P<0.001; ****P<0.0001. CON, control; KHK-KO, fructokinase knockout; WAN, water at night; WAT, water all time.
Figure 3
Figure 3
Dehydration causes renal dysfunction. (a) Urinary neutrophil gelatinase-associated lipocalin (NGAL)/creatinine (Cr) ratio. (b) Serum creatinine (measured by high-performance liquid chromatography (HPLC)). Data represent analysis of variance (ANOVA) (Bonferroni post test) *P<0.05. CON, control; KHK-KO, fructokinase knockout; WAN, water at night; WAT, water all time.
Figure 4
Figure 4
Renal histology. Proximal tubular injury (loss of brush border with tubular dilation; arrows) is observed in wild-type mice that were dehydrated without water (WAN) (b). Comparing with the groups WT-WAT (a); WT-Control (c); KHK-KO-WAT (d); KHK-KO-WAN (e); and KHK-KO Control (f). Scale bar=50 μm. KHK-KO, fructokinase-knockout; WAN, water at night; WAT, water all time; WT, wild type.
Figure 5
Figure 5
Proximal tubular brush border staining using angiotensin-converting enzyme (ACE) antibody. Proximal tubular brush border is decreased in the renal cortex (black arrows) of wild-type mice with dehydration-associated kidney injury (b) compared with other groups (a, cf). Percentage of positively stained area is shown in (g). Creatine kinase levels are normal and similar among groups (h). Scale bar=50 μm. KHK-KO, fructokinase knockout; WAN, water at night; WAT, water all time; WT, wild type.
Figure 6
Figure 6
Inflammation occurs with chronic dehydration. (a) Renal cortical MCP-1 protein levels; (b) infiltrating macrophages F4/80 stain. Data represent analysis of variance (ANOVA) (Bonferroni post test) *P<0.05; ***P<0.001. CON, control; KHK-KO, fructokinase knockout; MCP-1, monocyte chemotactic protein-1; WAN, water at night; WAT, water all time.
Figure 7
Figure 7
Macrophage (F4/80) infiltration with chronic dehydration. Wild-type mice with water provided only at night show increased macrophage infiltration (arrows) (b) compared with other groups WT-WAT (a); WT-Control (c); KHK-KO-WAT (d); KHK-KO-WAN (e); and KHK-KO Control (f). Scale bar=50 μm. KHK-KO, fructokinase knockout; WAN, water at night; WAT, water all time; WT, wild type.
Figure 8
Figure 8
Interstitial collagen III deposition with chronic dehydration. Wild-type mice with water provided only at night show increased interstitial fibrosis (b), compared with other groups. WT-WAT (a); WT-Control (c); KHK-KO, WAT (d); WAN (e); and Control (f). Scale bar=50 mm. KHK-KO, fructokinase knockout; WAN, water at night; WAT, water all time; WT, wild type.
Figure 9
Figure 9
Interstitial fibrosis (type III collagen staining) occurs with chronic dehydration. Data represent analysis of variance (ANOVA) (Bonferroni post test) **P<0.01. CON, control; KHK-KO, fructokinase knockout; WAN, water at night; WAT, water all time.
Figure 10
Figure 10
Systolic blood pressure (BP) at 4 weeks. Systolic blood pressure was increased in the WT WAN mice compared with all other groups. KHK-KO mice that were dehydrated without water (WAN) also showed a higher BP, but it was significantly less than that in WAN WT mice. Data represent analysis of variance (ANOVA) (Bonferroni post test) *P<0.05; ****P<0.0001. CON, control; KHK-KO, fructokinase knockout; WAN, water at night; WAT, water all time.
Figure 11
Figure 11
Uric acid levels after 7 h of dehydration. (a) Renal cortical uric acid levels. (b) Serum uric acid levels. Data represent analysis of variance (ANOVA) (Bonferroni post test) *P<0.05; **P<0.01. CON, control; KHK-KO, fructokinase knockout; WAN, water at night; WAT, water all time.

Comment in

References

    1. Torres C, Aragon A, Gonzalez M, et al. Decreased kidney function of unknown cause in Nicaragua: a community-based survey. Am J Kidney Dis. 2010;55:485–496. - PubMed
    1. O'Donnell JK, Tobey M, Weiner DE, et al. Prevalence of and risk factors for chronic kidney disease in rural Nicaragua. Nephrol Dial Transplant. 2011;26:2798–2805. - PMC - PubMed
    1. Peraza S, Wesseling C, Aragon A, et al. Decreased kidney function among agricultural workers in El Salvador. Am J Kidney Dis. 2012;59:531–540. - PubMed
    1. Bouby N, Fernandes S. Mild dehydration, vasopressin and the kidney: animal and human studies. Eur J Clin Nutr. 2003;57 (Suppl 2:S39–S46. - PubMed
    1. Bolignano D, Zoccali C. Vasopressin beyond water: implications for renal diseases. Curr Opin Nephrol Hypertens. 2010;19:499–504. - PubMed

Publication types

MeSH terms