Personalized prophylactic anticoagulation decision analysis in patients with membranous nephropathy
- PMID: 24336031
- PMCID: PMC4040154
- DOI: 10.1038/ki.2013.476
Personalized prophylactic anticoagulation decision analysis in patients with membranous nephropathy
Abstract
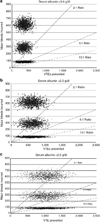
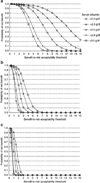
Primary membranous nephropathy is associated with increased risk of venous thromboembolic events, which are inversely correlated with serum albumin levels. To evaluate the potential benefit of prophylactic anticoagulation (venous thromboembolic events prevented) relative to the risk (major bleeds), we constructed a Markov decision model. The venous thromboembolic event risk according to serum albumin was obtained from an inception cohort of 898 patients with primary membranous nephropathy. Risk estimates of hemorrhage were obtained from a systematic literature review. Benefit-to-risk ratios were predicted according to bleeding risk and serum albumin. This ratio increased with worsening hypoalbuminemia from 4.5:1 for an albumin under 3 g/dl to 13.1:1 for an albumin under 2 g/dl in patients at low bleeding risk. Patients at intermediate bleeding risk with an albumin under 2 g/dl have a moderately favorable benefit-to-risk ratio (under 5:1). Patients at high bleeding risk are unlikely to benefit from prophylactic anticoagulation regardless of albuminemia. Probabilistic sensitivity analysis, to account for uncertainty in risk estimates, confirmed these trends. From these data, we constructed a tool to estimate the likelihood of benefit based on an individual's bleeding risk profile, serum albumin level, and acceptable benefit-to-risk ratio (www.gntools.com). This tool provides an approach to the decision of prophylactic anticoagulation personalized to the individual's needs and adaptable to dynamic changes in health status and risk profile.
Figures


Comment in
-
Thrombo-prevention in membranous nephropathy: a new tool for decision making?Kidney Int. 2014 Jun;85(6):1265-6. doi: 10.1038/ki.2013.541. Kidney Int. 2014. PMID: 24875548
References
-
- Orth SR, Ritz E. The nephrotic syndrome. N Engl J Med. 1998;338:1202–1211. - PubMed
-
- Velasquez Forero F, Garcia Prugue N, Ruiz Morales N. Idiopathic nephrotic syndrome of the adult with asymptomatic thrombosis of the renal vein. Am J Nephrol. 1988;8:457–462. - PubMed
-
- Llach F. Thromboembolic complications in nephrotic syndrome. Coagulation abnormalities, renal vein thrombosis, and other conditions. Postgrad Med. 1984;76:111–123. - PubMed
-
- Wagoner RD, Stanson AW, Holley KE, et al. Renal vein thrombosis in idiopathic membranous glomerulopathy and nephrotic syndrome: incidence and significance. Kidney Int. 1983;23:368–374. - PubMed
Publication types
MeSH terms
Substances
Grants and funding
LinkOut - more resources
Full Text Sources
Other Literature Sources
Medical

