. 2014 Apr;21(4):582-93.
doi: 10.1038/cdd.2013.180. Epub 2013 Dec 13.

Microglia convert aggregated amyloid-β into neurotoxic forms through the shedding of microvesicles

Affiliations

Microglia convert aggregated amyloid-β into neurotoxic forms through the shedding of microvesicles

P Joshi et al. Cell Death Differ. 2014 Apr.

Abstract

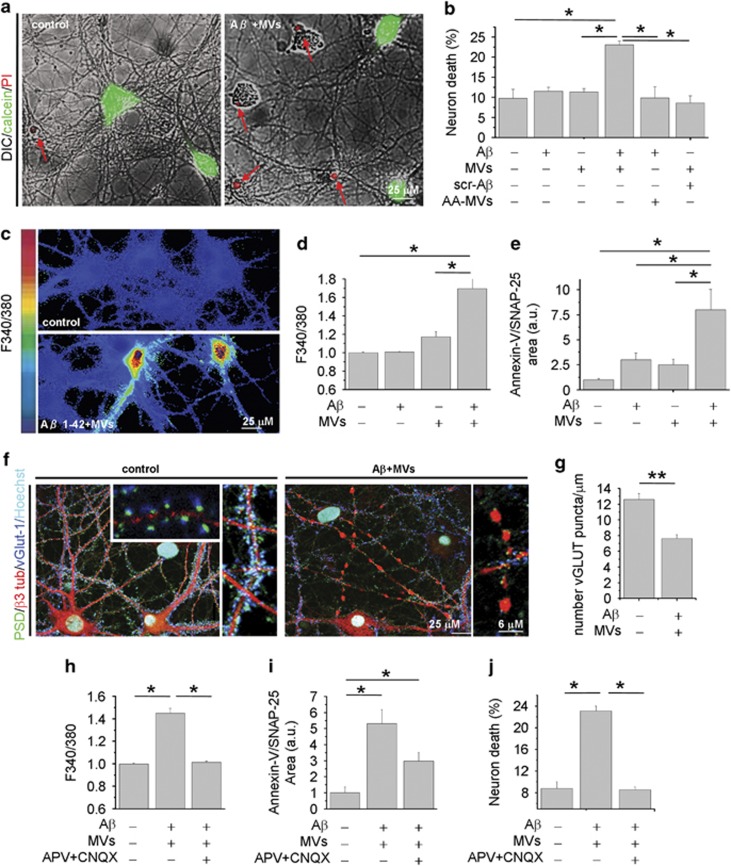
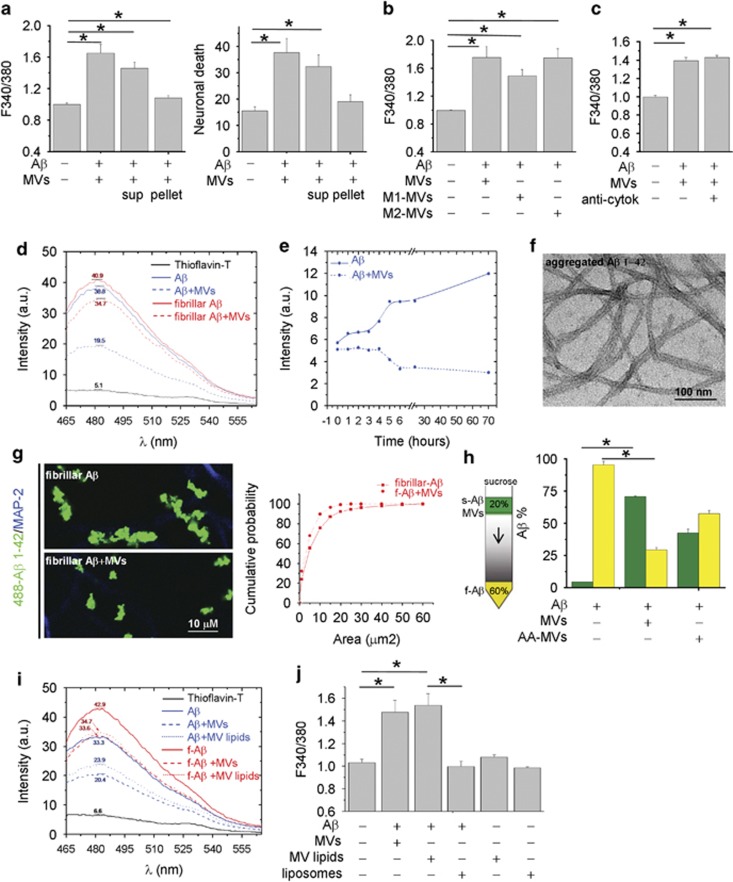
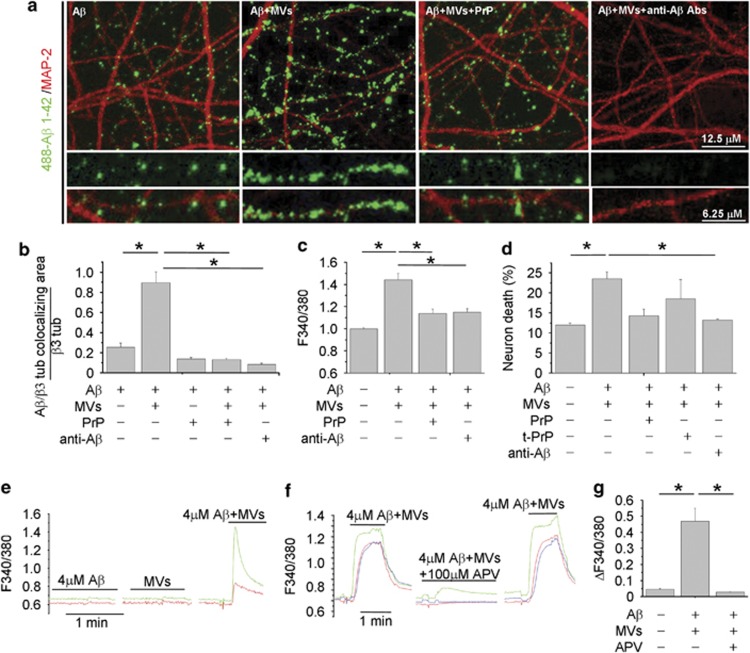
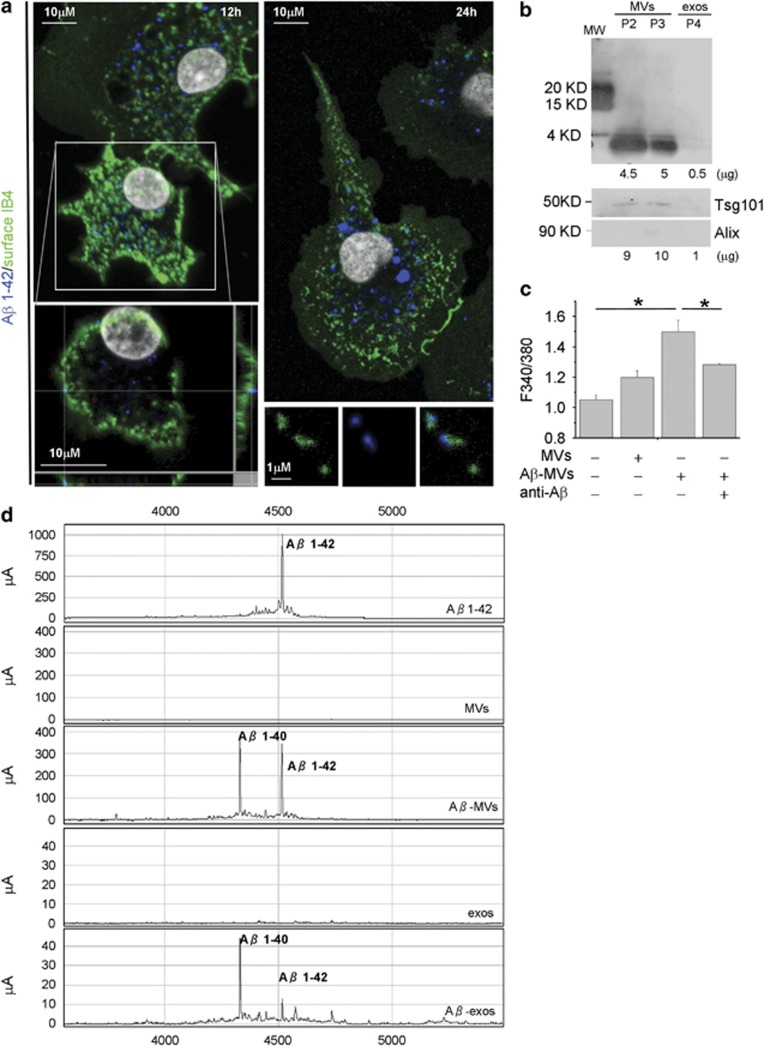
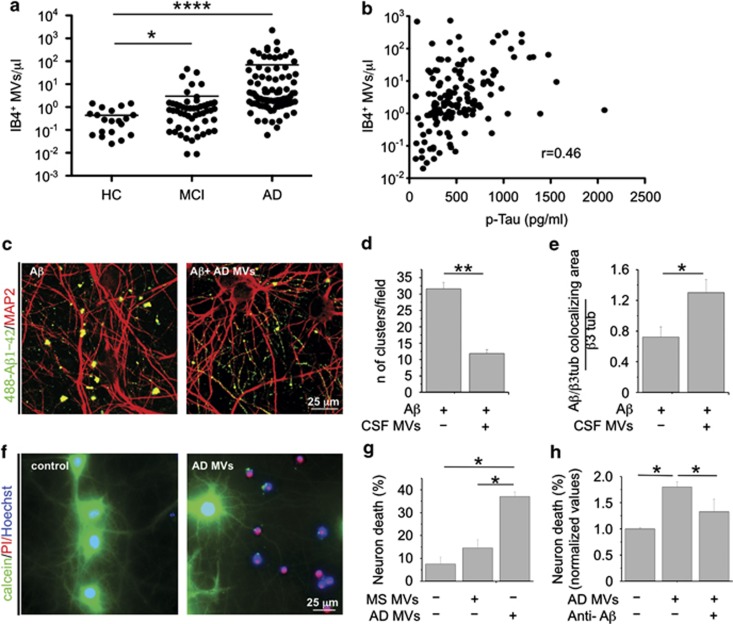
Alzheimer's disease (AD) is characterized by extracellular amyloid-β (Aβ) deposition, which activates microglia, induces neuroinflammation and drives neurodegeneration. Recent evidence indicates that soluble pre-fibrillar Aβ species, rather than insoluble fibrils, are the most toxic forms of Aβ. Preventing soluble Aβ formation represents, therefore, a major goal in AD. We investigated whether microvesicles (MVs) released extracellularly by reactive microglia may contribute to AD degeneration. We found that production of myeloid MVs, likely of microglial origin, is strikingly high in AD patients and in subjects with mild cognitive impairment and that AD MVs are toxic for cultured neurons. The mechanism responsible for MV neurotoxicity was defined in vitro using MVs produced by primary microglia. We demonstrated that neurotoxicity of MVs results from (i) the capability of MV lipids to promote formation of soluble Aβ species from extracellular insoluble aggregates and (ii) from the presence of neurotoxic Aβ forms trafficked to MVs after Aβ internalization into microglia. MV neurotoxicity was neutralized by the Aβ-interacting protein PrP and anti-Aβ antibodies, which prevented binding to neurons of neurotoxic soluble Aβ species. This study identifies microglia-derived MVs as a novel mechanism by which microglia participate in AD degeneration, and suggest new therapeutic strategies for the treatment of the disease.


Figures

Figure 1
Figure 1
Microglia-derived MVs promote Aβ neurotoxicity. Fourteen DIV hippocampal neurons were exposed for 1 h to Aβ 1–42 or scrambled Aβ 1–42 (4 μM) pre-incubated with MVs (1 μg/100 μl) overnight in neuronal medium. (a) Overlays of DIC and fluorescence microscopic images of neurons stained for calcein and propidium iodide (PI), after 24 h exposure to Aβ 1–42/MVs mixture or under control conditions. (b) Percentage of calcein−/PI+ neurons (dead cells) in cultures exposed to Aβ 1–42, scrambled Aβ 1–42, MVs or Aβ 1–42/scrambled Aβ 1–42 incubated overnight with MVs. AA-MVs refer to freshly isolated MVs added to Aβ 1–42, just before neuron challenge (the Kruskal–Wallis ANOVA, P<0.001; Dunn's test for comparison among groups, *P<0.05). (c) Basal [Ca2+]i was measured in single neurons loaded with the ratiometric calcium dye Fura-2 and expressed as F340/380 fluorescence. Representative pseudocolor images of 9DIV control neurons and neurons treated with Aβ1–42/MVs mixture for 1 h. The color scale is shown on the left. (d) Quantification of basal [Ca2+]i in neurons exposed to Aβ 1–42, MVs or Aβ 1–42 in combination with MVs. At least 100 neurons/condition were examined. Values are normalized to control (the Kruskal–Wallis ANOVA, P=0.002; Dunn's test for comparison among groups, *P<0.05). (e) Quantification of early apoptotic damage, revealed by Annexin-V binding, normalized to SNAP-25 immunoreactive area, in neurons treated as in d. (the Kruskal–Wallis ANOVA, P=0.001; Dunn's test for comparison among groups, *P<0.05). (f) Confocal microscopic images of 14DIV neurons untreated or pretreated with Aβ 1–42 in combination with MVs and stained for β-3 tubulin, the vesicular glutamate transporter vGlut-1 and the postsynaptic marker PSD-95. Nuclei are stained with Hoechst. Note, fragmentation of neuronal processes and loss of excitatory synapses in neurons exposed to Aβ 1–42/ MVs mixture. Density of excitatory synaptic puncta is quantified in g (data follow normal distribution, Student's t–test, **P<0.001). (hj) Control cultures and cells treated with Aβ 1–42/MVs mixture analyzed for basal [Ca2+]i  (h, the Kruskal–Wallis ANOVA, P=0.001; Dunn's test for comparison among groups, *P<0.05), early apoptotic damage (i, the Kruskal–Wallis ANOVA, P=0.001; Dunn's test for comparison among groups, *P<0.05) and calcein/PI staining (j, the Kruskal–Wallis ANOVA P<0.001; Dunn's test for comparison among groups, *P<0.05), either in the presence or in the absence of the glutamate receptor antagonists APV and CNQX
Figure 2
Figure 2
Shed MVs promote formation of soluble forms of Aβ 1–42. (a) Basal [Ca2+]i in neurons exposed for 1 h either to Aβ 1–42/MVs mixture or soluble (sup)/insoluble (pellet) fractions (left panel, the Kruskal–Wallis ANOVA, P<0.001; Dunn's test for comparison among groups, *P<0.05). Values are normalized to control. Right panel shows the percentage of calcein−/PI+ neurons under the same conditions (the Kruskal–Wallis ANOVA, P=0.002; Dunn's test for comparison among groups, *P<0.05). (b) Basal [Ca2+]i in neurons exposed for 1 h to MVs derived from resting, M1 or M2 microglia pre-incubated with extracellular Aβ 1–42. Values are normalized to control (the Kruskal–Wallis ANOVA, P<0.001; Dunn's test for comparison among groups, *P<0.05). (c) Basal [Ca2+]i in neurons exposed to Aβ 1–42 and/or MVs in the presence or in the absence of neutralizing antibodies for IL-1β and TNFα. Values are normalized to control. (d) Representative ThT fluorescence emission spectra of samples containing Aβ1–42 fibrils (dashed red lines) or aggregated Aβ 1–42 (dashed blue lines) exposed to MVs. (e) Time course of fibrilization of Aβ 1–42 in the presence (dashed line) or in the absence (solid line) of MVs. (f) Negative staining electron microscopic image of aggregated Aβ 1–42, incubated overnight in neuronal medium. (g) Representative confocal images of Hylite-488-Aβ 1–42 (488-Aβ 1–42) fibrils untreated or treated overnight with MVs and exposed for 1 h to neurons. Neurons are stained in blue for MAP-2 after fixation. Cumulative distribution of fibril size from control (solid line) and MV-treated (dashed line) 488-Aβ 1–42 fibril preparations is shown on the right. (h) ‘Floating assay' by ultracentrifugation reveals an increase of soluble Aβ 1–42 species in association with MVs. After centrifugation for 1 h at 100 000 × g, MVs are expected in the top fraction, whereas Aβ 1–42 aggregates are expected in the pellet. As ELISA indicates, a higher fraction of Aβ 1–42 species is transported from the bottom to the top of the gradient in samples incubated overnight with MVs. Acute addition of MVs (AA-MVs) does not cause statistically significant changes in Aβ 1–42 distribution (the Kruskal–Wallis ANOVA, P<0.001; Tukey's test for comparison among groups, *P<0.05). (i) ThT fluorescence emission spectra of aggregated Aβ 1–42 (blue lines) or Aβ 1–42 fibrils (red lines), untreated (solid lines) or pretreated (dashed lines) with shed MVs. Spectra of aggregated Aβ 1–42 or Aβ 1–42 fibrils exposed to MVs lipids (dotted lines) are also shown. (j) Basal [Ca2+]i of neurons exposed for 1 h to Aβ 1–42 pretreated with intact MVs, small unilamellar vesicles of MV lipids (MV lipids) or artificial liposomes. Note that vesicles made by lipids extracted from shed MVs but not artificial liposomes significantly enhance basal [Ca2+]i
Figure 3
Figure 3
Binding of newly generated soluble 488-Aβ-1–42 to neurons is competed by PrPC. (a) Representative confocal images of 14DIV neurons exposed to 488-Aβ 1–42 alone or in combination with MVs, with or without pretreatment with PrP or with the anti-Aβ antibodies A11 and 6E10. (b) Corresponding quantification of 488-Aβ 1–42 binding to cultured neurons expressed as colocalizing area between 488-Aβ and β tubulin, relative to total β tubulin (see Materials and Methods) (the Kruskal–Wallis ANOVA, P<0.001; Dunn's test comparison among groups, *P<0.05). (c and d) Basal [Ca2+]i (c) and percentage of calcein−/PI+ neurons (d) in 9–14 DIV cultures exposed to different combinations of Aβ 1–42, MVs, A11 plus 6E10 antibodies, full-length or truncated (tPrPC) PrPC (the Kruskal–Wallis ANOVA, P<0.001; Dunn's test for comparison among groups, *P<0.05). (eg) Bio-detection of soluble Aβ 1–42 by fura-2-loaded sensor neurons, expressing functional NMDA receptors. Representative traces of [Ca2+]i changes recorded in neurons upon exposure to KRH containing Aβ 1–42 alone (4 μM) or MVs alone (1 μg/100 μl) or their combination (e). [Ca2+]i responses induced by Aβ 1–42/MVs mixture are strongly inhibited by the NMDA receptor antagonist APV (f), as quantified in g. Values represent peak [Ca2+]i increases (ΔF340/380 fluorescence) from about 30 neurons/condition (the Kruskal–Wallis ANOVA, P<0.001; Dunn's test for comparison among groups, *P<0.05)
Figure 4
Figure 4
Soluble Aβ forms are released in association with shed MVs from microglia activated with Aβ 1–42. (a) Living rat microglia were exposed to human Aβ 1–42 for 12–48 h and stained with IB4-FITC to label the cell surface before being fixed and counterstained with 6E10 antibody, which recognizes human but not rat amyloids. Top left panel shows representative xy plane maximum projection of microglia, revealing several 6E10 immunoreactive puncta inside the cells, some of which are double positive for surface IB4-FITC. Bottom left panel showing single stack of the selected cell, shown at higher magnification, reveals a clear association of internalized Aβ 1–42 to the cell surface, further revealed by the z axis scan. Note, an increase in the size of internalized Aβ 1–42 after incubation for 48 h (top right panel). Examples of EMVs, double positive for 6E10 and IB4-FITC are shown in bottom right panels. (b) Western blot analysis of Aβ 1–42 species present in shed MVs (P2 and P3 fractions) and exosomes (P4 fraction) released upon 30 min ATP stimulation by 4 × 10⁶ microglia pre-exposed to biotinylated Aβ 1–42 (4 μM). Blots were carried out using a 15% Tris-glycine gel and membranes were probed with streptavidin. Shed MVs and exosomes produced by 8 × 10⁶ donor microglia were probed in parallel for the EMV markers Tsg101 and the exosomal marker Alix (lower panels). Numbers below each lane indicate the estimated amount of loaded proteins. (c) Shed MVs and exosomes produced by 1 × 10⁶ rat microglia pre-exposed to human Aβ 1–42 were analyzed by a SELDI-TOF MS immunoproteomic assay employing anti-human Aβ antibodies (4G8 and 6E10) on PS20 chip array to capture Aβ 1–42 and carboxy-terminally truncated Aβ isoforms. The following representative spectra of samples in NP40 1% lysis buffer are shown (from top to bottom): 4 μM Aβ1–42 peptide incubated overnight in KRH; MVs from control microglia, not exposed to Aβ1–42; MVs from Aβ1–42 preloaded microglia (Aβ-MVs); exosomes from control microglia (exos); exosomes from Aβ1–42 preloaded microglia (Aβ-exos). (d) Basal [Ca2+]i recorded from neurons exposed to MVs produced from microglia either resting or pretreated for 48 h with Aβ 1–42 (Aβ-MVs), in the presence or in the absence of anti-Aβ antibodies (A11+6E10) (the Kruskal–Wallis ANOVA, P<0.001; Dunn's test for comparison among groups, *P<0.05). See also Supplementary Figure S1
Figure 5
Figure 5
CSF MVs isolated from AD patients. (a) Quantitative flow cytometry analysis of IB4+ MVs in CSF collected from MCI patients (n=53), AD patients (n=89) and age- and gender-matched controls (HC; n=20) (the Mann–Whitney test, P<0.0001 AD versus HC; P<0.0329 MCI versus HC). (b) Correlation between IB4+ MVs and total tau protein in the CSF of MCI and AD patients, (rho=0.46, P<0.0001, Spearman's correlation). (c) Representative confocal images of cultured neurons, exposed to aggregated 488-Aβ 1–42 untreated or pretreated overnight with MVs from AD patients and stained for MAP-2 after fixation (red). Aβ species bind to MAP-2 dendrites. Note the decrease in the number of large fluorescent Aβ clusters in neurons exposed to 488-Aβ 1–42 in combination with AD MVs. (d) Quantification of 488-Aβ 1–42 aggregates (larger than 5 μm) per field (data follow normal distribution, Student's t–test, **P<0.001). (e) Quantification of 488-Aβ 1–42 binding to cultured neurons, expressed as colocalizing area between 488-Aβ and β tubulin, relative to total β tubulin (see materials and Methods; data follow normal distribution, Student's t–test, **P<0.001). (f) Representative fluorescence microscopy images of 14DIV neurons triple stained for calcein, PI and Hoechst 24 h after exposure to AD MVs or maintained in control conditions. (g) Quantification of the percentage of calcein−/PI+ neurons (dead cells) in cultures exposed to AD MVs or MVs isolated from patients with multiple sclerosis (the Kruskal–Wallis ANOVA, P<0.001; Dunn's test for comparison among groups, *P<0.05). (h) Percentage of dead neurons in cultures exposed to MVs isolated from the CSF of AD patients in the presence of anti-Aβ antibodies A11 and 6E10 (ANOVA, P<0.001, the Holm–Sidak method, P<0.05). See also Supplementary Figure S2 and Supplementary Table S1

Similar articles

Cited by

References

    1. Herring A, Lewejohann L, Panzer AL, Donath A, Kroll O, Sachser N, et al. Preventive and therapeutic types of environmental enrichment counteract beta amyloid pathology by different molecular mechanisms. Neurobiol Dis. 2011;42:530–538. - PubMed
    1. Schilling S, Lauber T, Schaupp M, Manhart S, Scheel E, Bohm G, et al. On the seeding and oligomerization of pGlu-amyloid peptides (in vitro) Biochemistry. 2006;45:12393–12399. - PubMed
    1. Bieschke J, Herbst M, Wiglenda T, Friedrich RP, Boeddrich A, Schiele F, et al. Small-molecule conversion of toxic oligomers to nontoxic beta-sheet-rich amyloid fibrils. Nat Chem Biol. 2012;8:93–101. - PubMed
    1. Winklhofer KF, Tatzelt J, Haass C. The two faces of protein misfolding: gain- and loss-of-function in neurodegenerative diseases. EMBO J. 2008;27:336–349. - PMC - PubMed
    1. Benilova I, Karran E, De Strooper B. The toxic Abeta oligomer and Alzheimer's disease: an emperor in need of clothes. Nat Neurosci. 2012;15:349–357. - PubMed

Publication types

MeSH terms