. 2013:4:2917.
doi: 10.1038/ncomms3917.

A failure in energy metabolism and antioxidant uptake precede symptoms of Huntington's disease in mice

Affiliations
Free PMC article

A failure in energy metabolism and antioxidant uptake precede symptoms of Huntington's disease in mice

Aníbal I Acuña et al. Nat Commun. 2013.
Free PMC article

Abstract

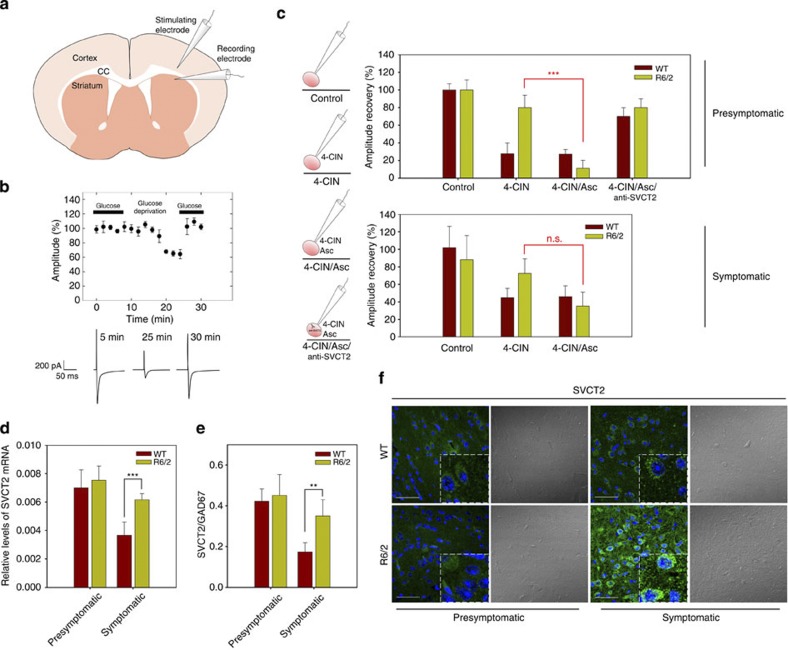
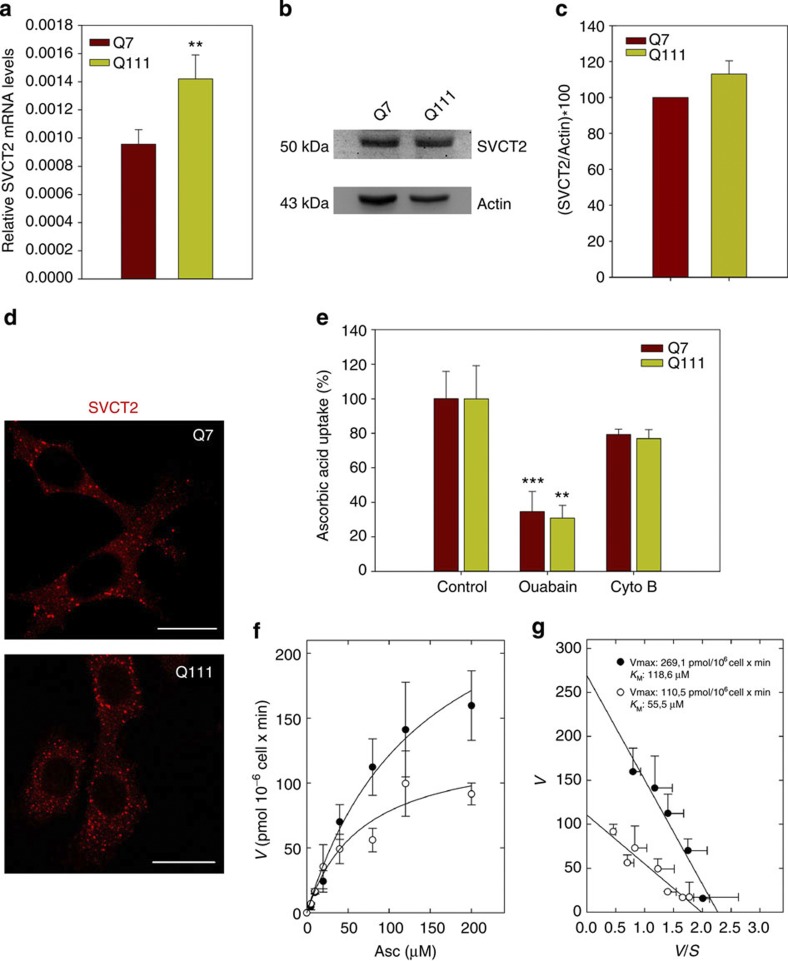
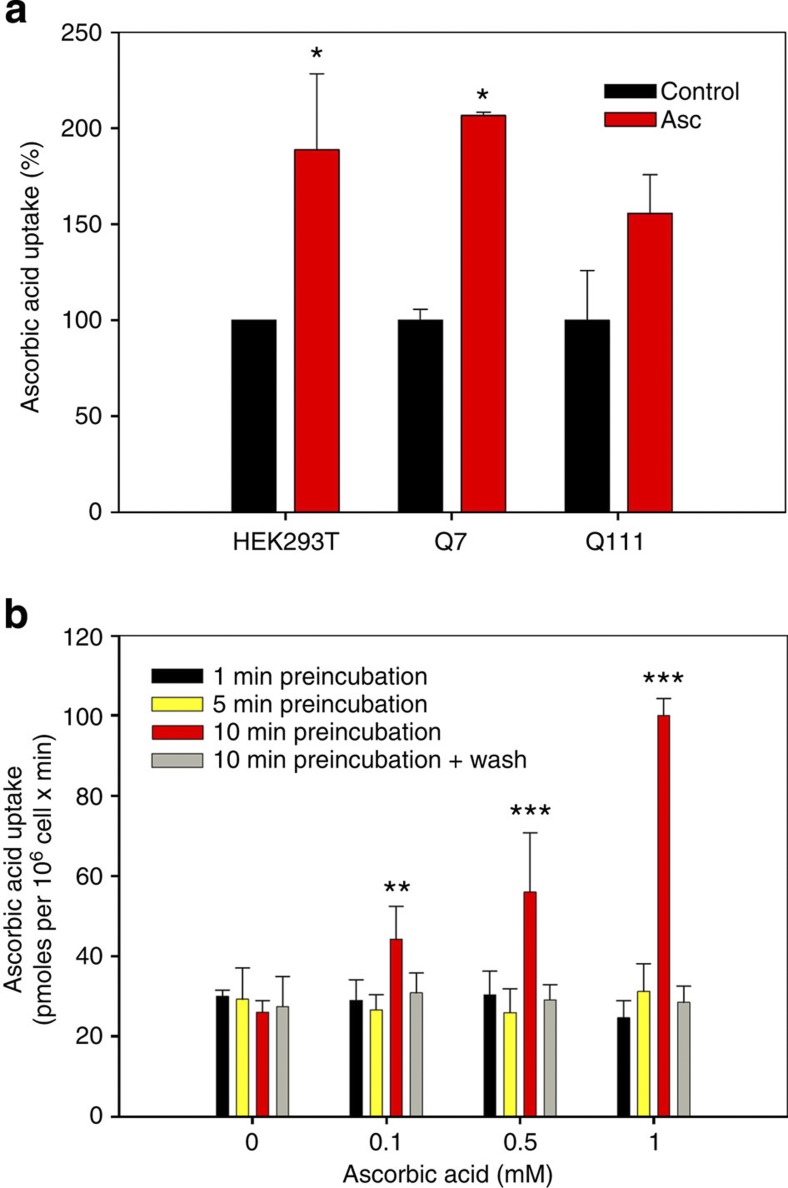
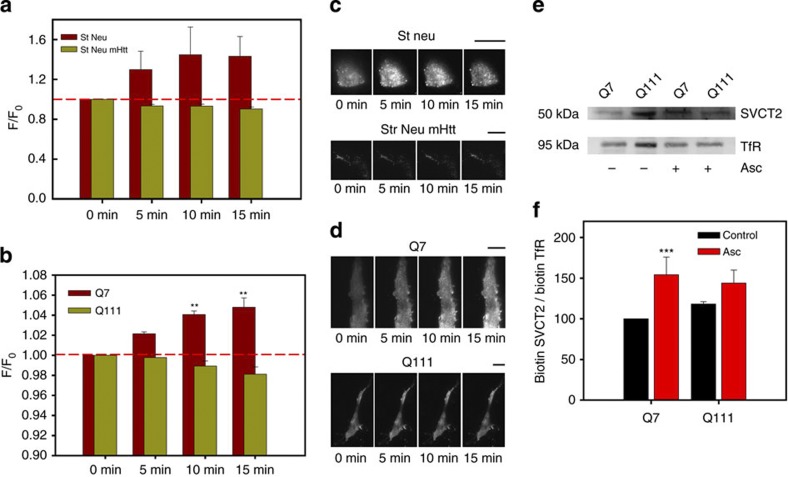
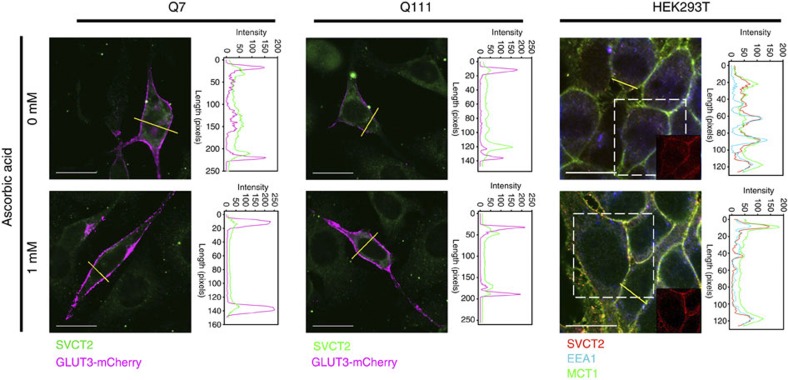
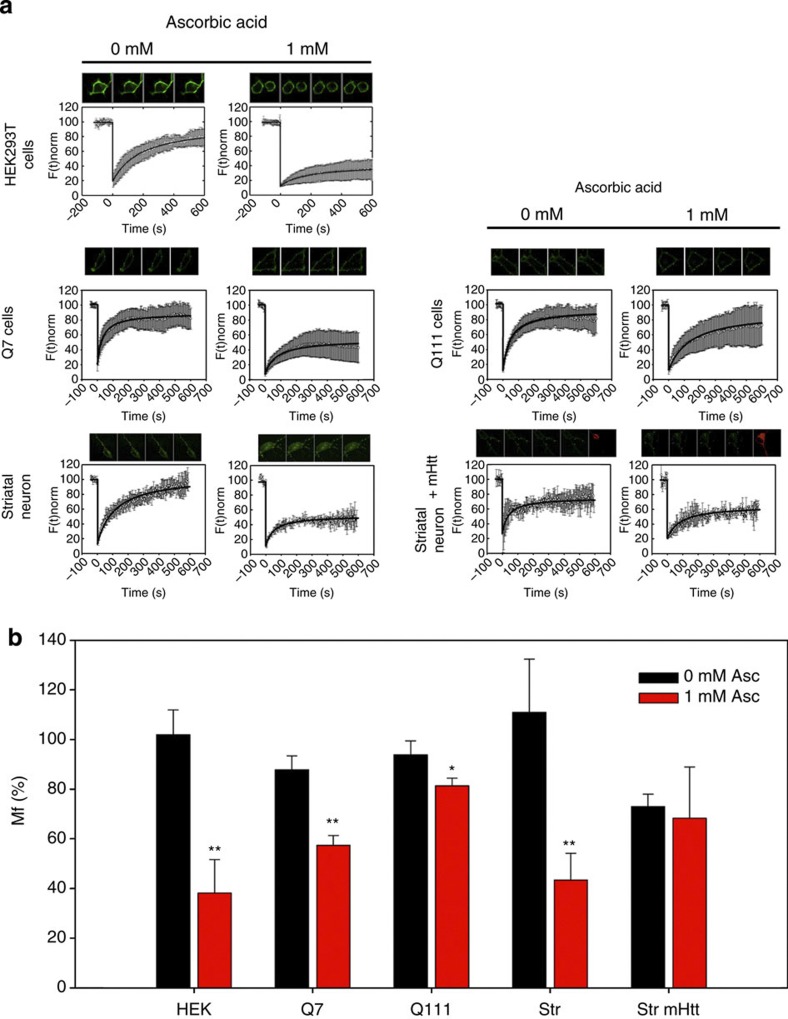
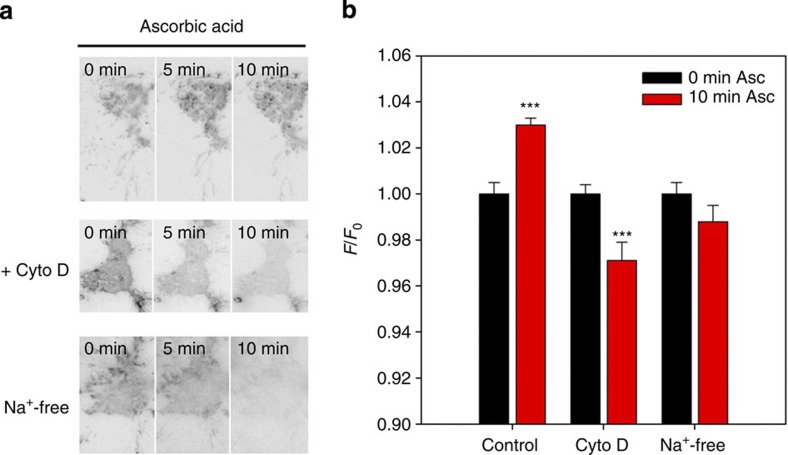
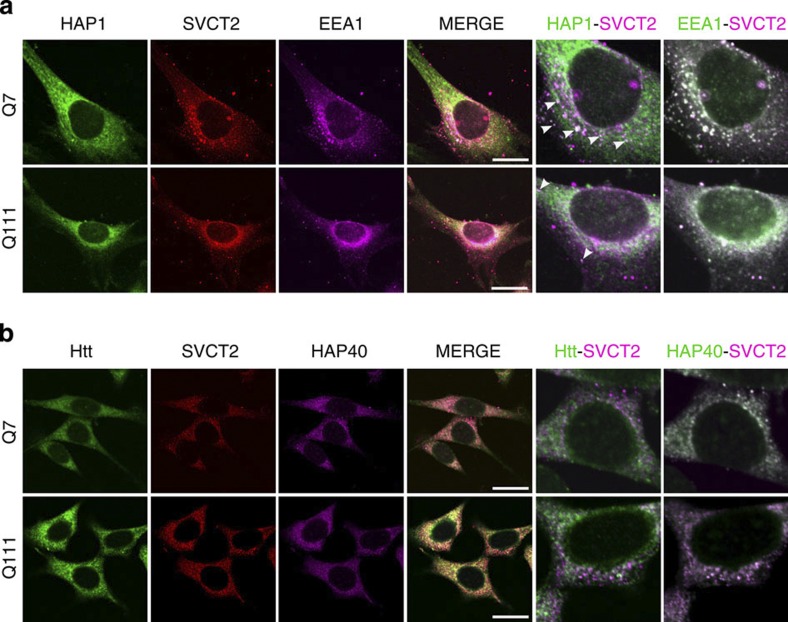
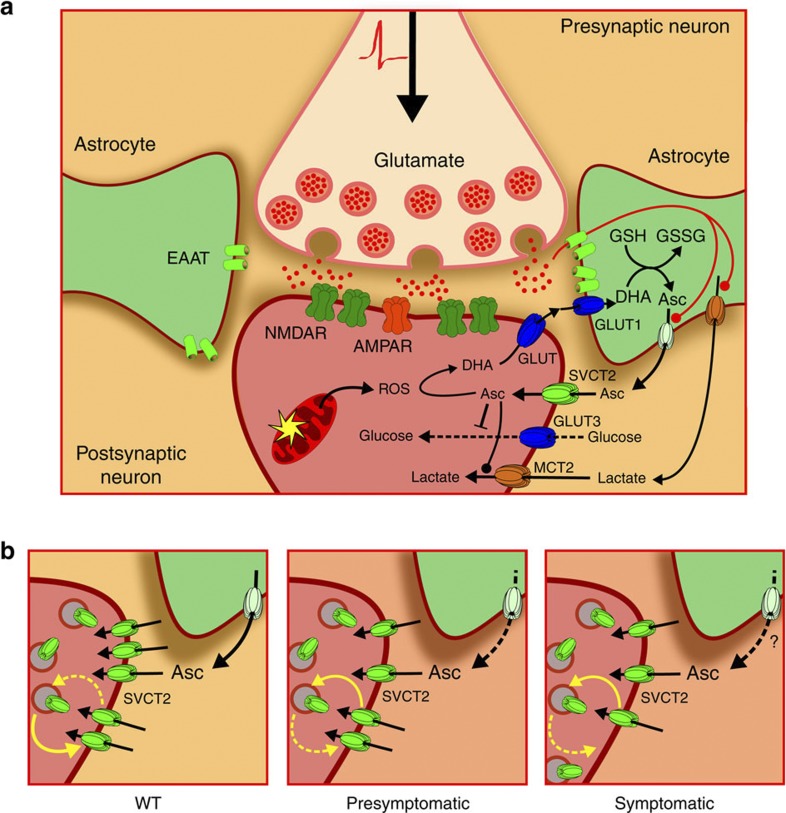
Huntington's disease has been associated with a failure in energy metabolism and oxidative damage. Ascorbic acid is a powerful antioxidant highly concentrated in the brain where it acts as a messenger, modulating neuronal metabolism. Using an electrophysiological approach in R6/2 HD slices, we observe an abnormal ascorbic acid flux from astrocytes to neurons, which is responsible for alterations in neuronal metabolic substrate preferences. Here using striatal neurons derived from knock-in mice expressing mutant huntingtin (STHdhQ cells), we study ascorbic acid transport. When extracellular ascorbic acid concentration increases, as occurs during synaptic activity, ascorbic acid transporter 2 (SVCT2) translocates to the plasma membrane, ensuring optimal ascorbic acid uptake for neurons. In contrast, SVCT2 from cells that mimic HD symptoms (dubbed HD cells) fails to reach the plasma membrane under the same conditions. We reason that an early impairment of ascorbic acid uptake in HD neurons could lead to early metabolic failure promoting neuronal death.


Figures

Figure 1
Figure 1. Ascorbic acid flux from glial cells to neurons is impaired in R6/2 mice.
(a) Schematic drawing of the experimental set-up showing positions of the stimulating electrode at corpus callosum (CC) and the recording electrode at dorsolateral striatum. (b) Time course of EPSC amplitudes in control experiment (with and without glucose). Representative EPSCs for a glucose-deprived slice (presymptomatic, WT). Calibration bar: 200 pA, 50 ms. (c) Schematic representation of experiments using the whole-cell patch-clamp configuration. Bar plots for EPSC amplitudes after glucose deprivation (amplitude recovery) with the treatments indicated in presymptomatic (3–4 weeks old) and symptomatic (10–12 weeks old) mice. Complete statistical analysis is shown in Table 1, n=5 for every condition, ***P<0.001. (d,e) qPCR assay for SVCT2 from mRNA extracts of striatum of presymptomatic (R6/2) and symptomatic (R6/2) mice. Striatum samples from littermate controls (WT) were used as controls. The results were normalized using specific primers to amplify mRNAs coding for β-actin and for GAD67, a 67-kDa isoform of glutamic acid decarboxylase, a marker for striatal neurons. Student’s t-test, n=4 for every condition, ***P<0.001. (f) Immunofluorescence analyses for SVCT2 (green, left side) in the striatum of R6/2 (showing HD symptoms) and WT mice. To the right are images produced with transmitted light DIC microscopy. Scale bars are 50 μm.
Figure 2
Figure 2. Ascorbic acid transport in HD cells is impaired.
(a) qPCR analyses for mRNA coding for SVCT2 in Q7 and Q111 cells. Student’s t-test, n=4, **P<0.01. (b,c) Western blot assay for SVCT2 of total protein extracts from Q7 and Q111 cells. Full unedited blot including molecular weight markers is shown in Supplementary Figs S1 and S2. Bar plots show quantification of SVCT2 western blot by densitometric scanning analysis. (d) Immunofluorescence analyses for SVCT2 (red) in Q7 and Q111 cells. Scale bars are 20 μm. (e) 14C-ascorbic acid transport analysis using a 1-min uptake assay (37 °C) in Q7 and Q111 cells. Inhibitors were preincubated for periods of 15 min (cytochalasin B, Cyto B) or 60 min (Ouabain) before performing the transport experiment. The absolute values of 14C-ascorbic acid uptake in controls were 157.1±19.2 (Q7 cells) and 70.0±11.1 (Q111 cells) pmol min−1 × 10⁶ cells. Student’s t-test, n=4, **P<0.01, ***P<0.001. (f) Dose–response curve of 14C-ascorbic acid, transport using a 1-min uptake assay at 37 °C in Q7 and Q111 cells. (g) Eadie–Hofstee plot. Data represent the mean±s.d. of four experiments. Single rectangular hyperbolae and lines were fitted using nonlinear regression (e) and linear regression (f). Linear and non-linear regressions were calculated using SigmaPlot v9.0 software (only correlations >0.9 were accepted).
Figure 3
Figure 3. Extracellular ascorbic acid preincubation stimulates ascorbic acid transport.
(a) Bar plots for 14C-ascorbic acid transport analysis using a 1-min uptake assay (37 °C) in Q7, Q111 and HEK293T cells. Cells were pretreated with 1 mM non-radioactive ascorbic acid for 5 min (HEK293T cells) or 10 min (Q cells) prior to performing the uptake assay. (b) Bar plots for 14C-ascorbic acid transport analysis using a 1-min uptake assay (37 °C) in HEK293T cells. Cells were preincubated with non-radioactive ascorbic acid at the concentrations indicated, for the times indicated. Analysis of variance (ANOVA) followed by the Bonferroni post-test, n=4, ***P<0.001, **P<0.01, *P<0.05.
Figure 4
Figure 4. Extracellular ascorbic acid preincubation induces translocation of SVCT2 to the plasma membrane.
(a,b) Bar plots for normalized fluorescence intensity obtained from TIRF microscopy images in primary cultures of striatal neurons expressing SVCT2-EGFP (St Neu), mHtt-DsRED (St Neu mHtt), Q7 and Q111 cells expressing SVCT2-EGFP. Analysis of variance (ANOVA) followed by the Bonferroni post-test, n=4 (Q cells, eight cells for every condition), n=3 (striatal neurons, six cells for every condition), **P<0.01. (c,d) TIRF microscopy images for SVCT2-EGFP showing a representative striatal neuron or Q cell. Data represent the mean±s.d. of eight cells. Scale bars are 10 μm. (e) Western blot analyses of biotinylated proteins from Q7 and Q111 cells. Where indicated, cells were preincubated with 1 mM ascorbic acid for 10 min prior to the biotinylation assay. Full unedited blot including molecular weight markers is shown in Supplementary Figs S3 and S4. (f) Bar plots for densitometric scanning analysis of the SVCT2 western blot. Student’s t-test, n=4, ***P<0.001.
Figure 5
Figure 5. Intracellular SVCT2 moves from early endosomes to the plasma membrane in response to extracellular ascorbic acid.
Immunofluorescence analyses for SVCT2 (green) Q cells expressing the plasma membrane marker, glucose transporter type 3-mCherry (GLUT3-mCherry, magenta) pretreated with ascorbic acid for 10 min at the given concentrations. Immunofluorescence analyses for SVCT2 (red), early endosome-associated protein 1 (EEA1, early endosome marker, blue) and the plasma membrane marker (monocarboxylate transporter 1, MCT1, green) in HEK293T cells pretreated with ascorbic acid for 10 min at the concentrations indicated. Line-scan data for yellow lines drawn across cells is shown next to each picture. Scale bars are 20 μm.
Figure 6
Figure 6. SVCT2 moves to a less mobile compartment after extracellular ascorbic acid incubation.
(a) Recovery curves for FRAP experiments in cells pretreated with ascorbic acid. Left: FRAP experiments for SVCT2-EGFP in HEK293T cells, Q7 cells and primary cultures of striatal neurons. Right: FRAP experiments for SVCT2-EGFP in Q111 cells and primary cultures of striatal neurons expressing mHtt-DsRED (mHtt). (b) Bar plots for Mf calculated from FRAP experiments in HEK293T cells, Q cells, cultured striatal neurons and cultured striatal neurons expressing mHtt-DsRED. Cells were pretreated with 0 or 1 mM ascorbic acid for 10 min at 37 °C. Student’s t-test, n=6 (HEK293 cells, 12 cells for every condition), n=4 (Q cells, 8 cells for every condition), n=3 (striatal neurons, 6 cells for every condition) **P<0.01, *P<0.05.
Figure 7
Figure 7. Endo and exocytosis inhibition induce a decrease of SVCT2 in the plasma membrane.
(a) TIRF microscopy images for NG108 cells expressing SVCT2-EGFP. Images show a representative cell incubated with 1 mM ascorbic acid. Where indicated, cells were additionally treated with 1 μg ml−1 cytochalasin D (Cyto D) or with Na+-free buffer. (b) Bar plots for normalized fluorescence intensity in NG108 cells using TIRF microscopy. Cells were pretreated with 0 or 1 mM ascorbic acid for 10 min at 37 °C in the presence of cytochalasin D or in the absence of Na+. Student’s t-test, n=5 (8 cells for every condition), ***P<0.001.
Figure 8
Figure 8. Cycling of SVCT2 to and from the plasma membrane.
(a) Bar plots for 14C-ascorbic acid transport analysis using a 1-min uptake assay (37 °C) in HEK293T cells. Cells were pretreated with 1mM non-radioactive ascorbic acid for 10 min prior to performing the uptake assay. Where indicated, cells were pretreated with cytochalasin D (1 μg ml−1, CytoD), phenylarsine oxide (50 μM, PAO) for 15 min at 37 °C. Na+-free: ascorbic acid preincubation was performed in a Na+-free solution. (b) Western blot analyses of biotinylated proteins from HEK293T cells. Cells were preincubated with 1 mM ascorbic acid for 10 min prior to the biotinylation assay. Where indicated, cells were pretreated with cytochalasin D (1 μg ml−1, Cyto D), phenylarsine oxide (50 μM, PAO) for 15 min at 37 °C. Na+-free: ascorbic acid preincubation was performed in a Na+-free solution. Full unedited blot including molecular weight markers is shown in Supplementary Figs S5 and S6. (c) Bar plots for densitometric scanning analysis of the SVCT2 western blot. Analysis of variance (ANOVA) followed by the Bonferroni post-test, n=4. Comparison between pretreatment with 0 and 1 mM ascorbic acid for each experimental condition, ***P<0.001, *P<0.05. Comparison between experimental conditions versus control cells pretreated with 0 mM ascorbic acid. aP<0.001, bP<0.01, cP<0.05.
Figure 9
Figure 9. Colocalization of HAP1 and SVCT2 is disrupted in cells expressing mHtt.
(a) Immunofluorescence analyses in Q7 and Q111 cells for HAP1 (green), SVCT2 (red) and EEA1 (magenta). To best appreciate colocalization of HAP1-SVCT2 and EEA1-SVCT2, images to the right are shown in magenta and green. (b) Immunofluorescence analyses in Q7 and Q111 cells for Htt (green), SVCT2 (red) and HAP40 (magenta). To best appreciate colocalization of Htt-SVCT2 and HAP40-SVCT2, images to the right are shown in magenta and green. Arrowheads indicate areas of colocalization. Scale bars are 20 μm.
Figure 10
Figure 10. Ascorbic acid flux between astrocytes and neurons is impaired in mouse model of HD.
(a) During corticostriatal pathway activation glutamate is released into the synaptic cleft. Astrocytes take up glutamate, which stimulates lactate efflux and ascorbic acid release from these cells. Ascorbic acid enters neurons through SVCT2. Intracellular ascorbic acid inhibits glucose consumption via specific GLUT3 inhibition and stimulates lactate uptake in neurons. Synaptic activity produces reactive oxidant species (ROS) that oxidize ascorbic acid to dehydroascorbic acid (DHA). DHA is released from neurons and is taken up by astrocytes through glucose transporters. Astrocytes can reduce oxidized ascorbic acid because they express specific glutathione-dependent reductases. (b) SVCT2 constantly cycles to and from the plasma membrane. When astrocytes release ascorbic acid, the increase in extracellular ascorbic acid concentration induces a decrease in the rate of SVCT2 endocytosis, which in turn increases SVCT2 at the cell surface. In presymptomatic stages of HD-like disease in mice, a failure in ascorbic acid release from glial cells can be observed. In contrast, in symptomatic stages of HD-like disease in mice, a failure in SVCT2 translocation to the plasma membrane is observed. AMPAR, (2-amino-3-(3-hydroxy-5-methyl-isoxazol-4-yl)propanoic acid receptor; Asc, ascorbic acid; DHA, dehydroascorbic acid, oxidized ascorbic acid; EAAT, excitatory amino acid transporter; GLUT3, glucose transporter isoform 3; GSH, reduced gluthatione; GSSG, oxidized gluthatione; NMDAR, N-methyl-D-aspartate receptor; MCT, monocarboxylate transporter; ROS, reactive oxygen species; SVCT2, sodium-vitamin C transporter isoform 2.

Similar articles

Cited by

References

    1. Vonsattel J. P. & DiFiglia M. Huntington disease. J. Neuropathol. Exp. Neurol. 57, 369–384 (1998). - PubMed
    1. The Huntington’s Disease Collaborative Research Group. A novel gene containing a trinucleotide repeat that is expanded and unstable on Huntington’s disease chromosomes. Cell 72, 971–983 (1993). - PubMed
    1. Twelvetrees A. E. et al. Delivery of GABAARs to synapses is mediated by HAP1-KIF5 and disrupted by mutant huntingtin. Neuron 65, 53–65 (2010). - PMC - PubMed
    1. Caviston J. P. & Holzbaur E. L. Huntingtin as an essential integrator of intracellular vesicular trafficking. Trends Cell Biol. 19, 147–155 (2009). - PMC - PubMed
    1. Gines S. et al. Specific progressive cAMP reduction implicates energy deficit in presymptomatic Huntington's disease knock-in mice. Hum. Mol. Genet. 12, 497–508 (2003). - PubMed

Publication types

MeSH terms