

Systematic review of the effect of pneumococcal conjugate vaccine dosing schedules on immunogenicity
- PMID: 24336054
- PMCID: PMC3940378
- DOI: 10.1097/INF.0000000000000079
Systematic review of the effect of pneumococcal conjugate vaccine dosing schedules on immunogenicity
Abstract
Background: Despite the breadth of studies demonstrating benefits of pneumococcal conjugate vaccine (PCV), uncertainty remains regarding the optimal PCV dosing schedule in infants.
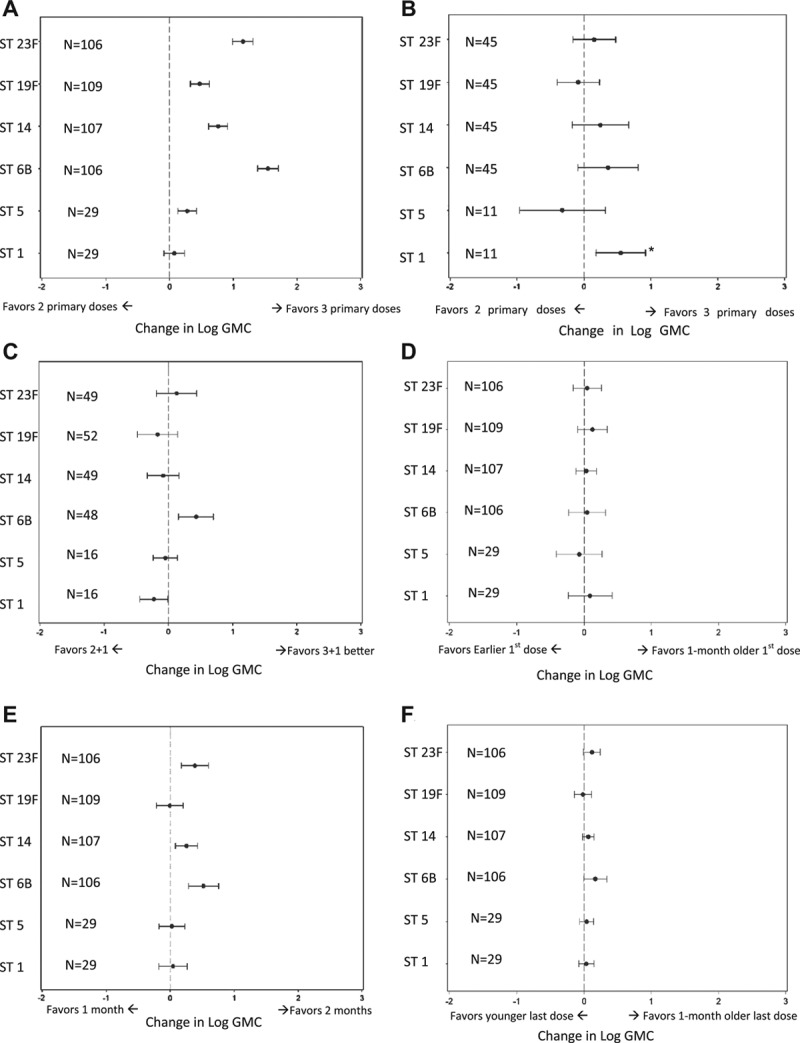
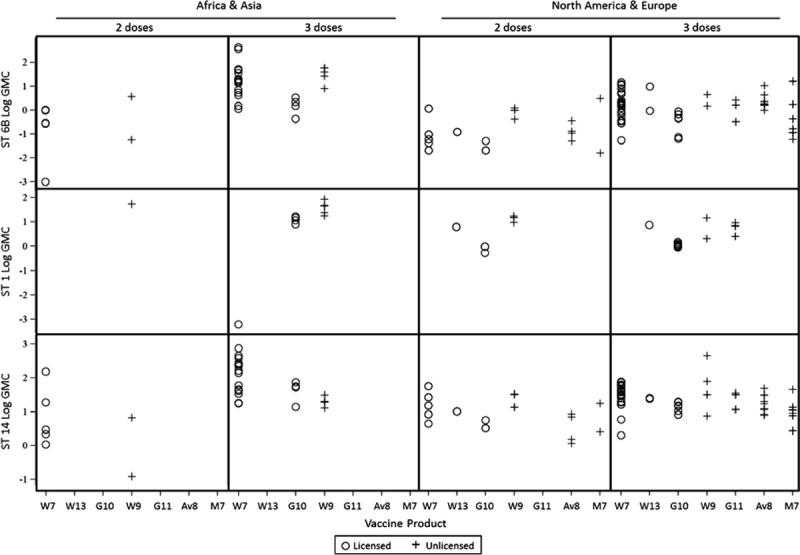
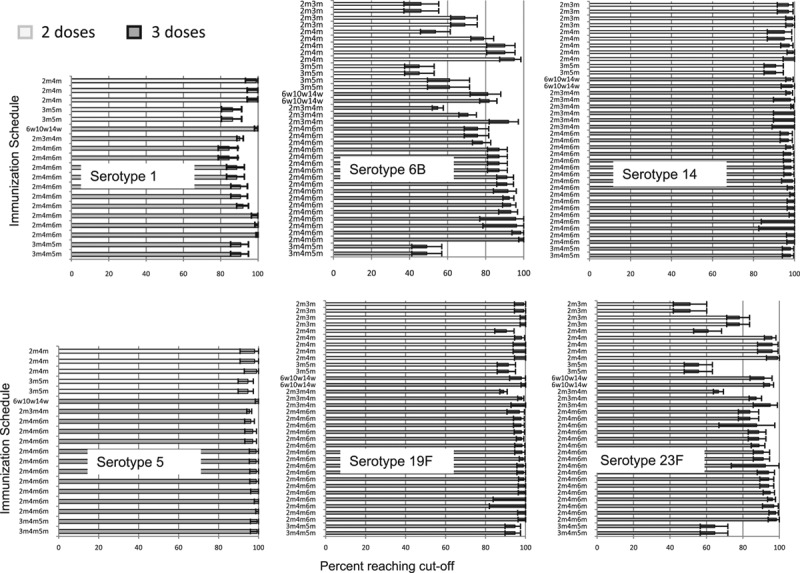
Methods: We conducted a systematic literature review of PCV immunogenicity published from 1994 to 2010 (supplemented post hoc with studies from 2011). Studies included for analysis evaluated ≥2 doses of 7-valent or higher product (excluding Aventis-Pasteur PCV11) administered to nonhigh-risk infants ≤6 months of age. Impact of PCV schedule on geometric mean antibody concentration (GMC) and proportion of subjects over 0.35 mcg/mL were assessed at various time points; the GMC 1 month postdose 3 (for various dosing regimens) for serotypes 1, 5, 6B, 14, 19F and 23F was assessed in detail using random effects linear regression, adjusted for product, acellular diphtheria-tetanus-pertussis/whole-cell diphtheria- tetanus-pertussis coadministration, laboratory method, age at first dose and geographic region.
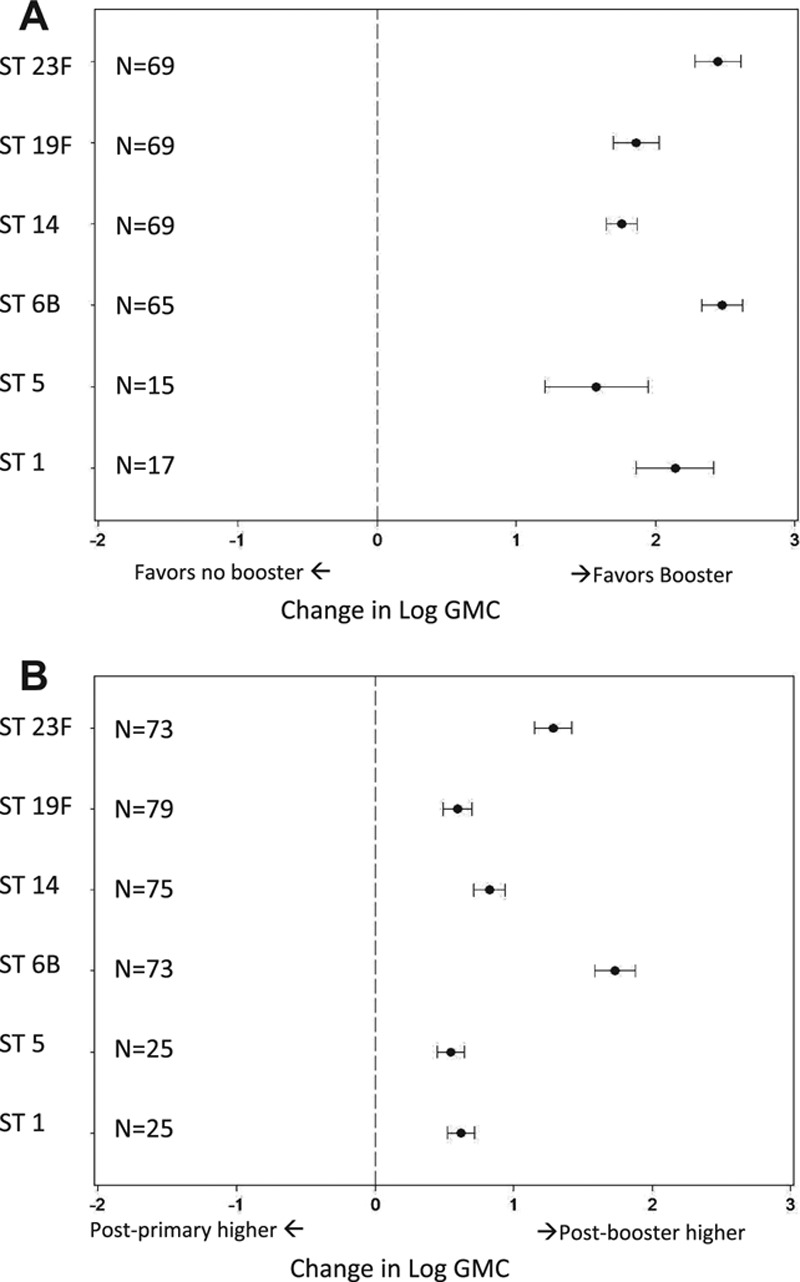
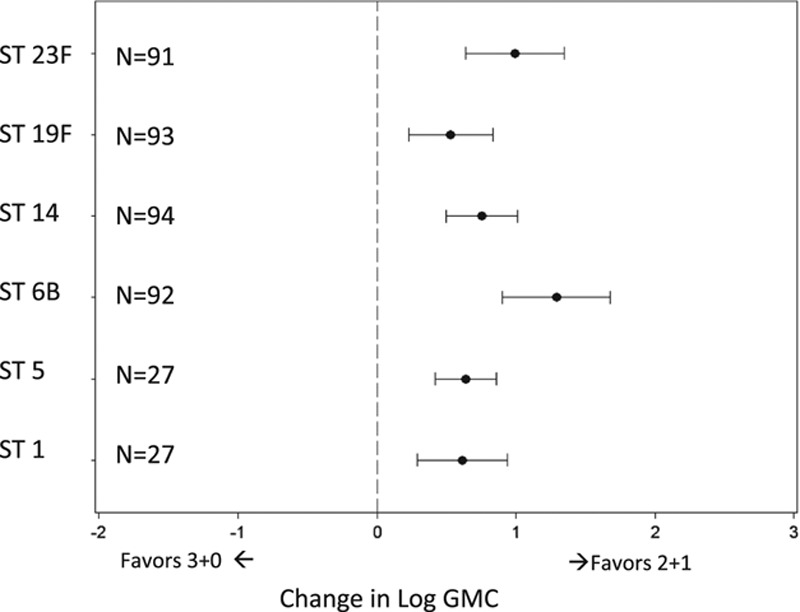
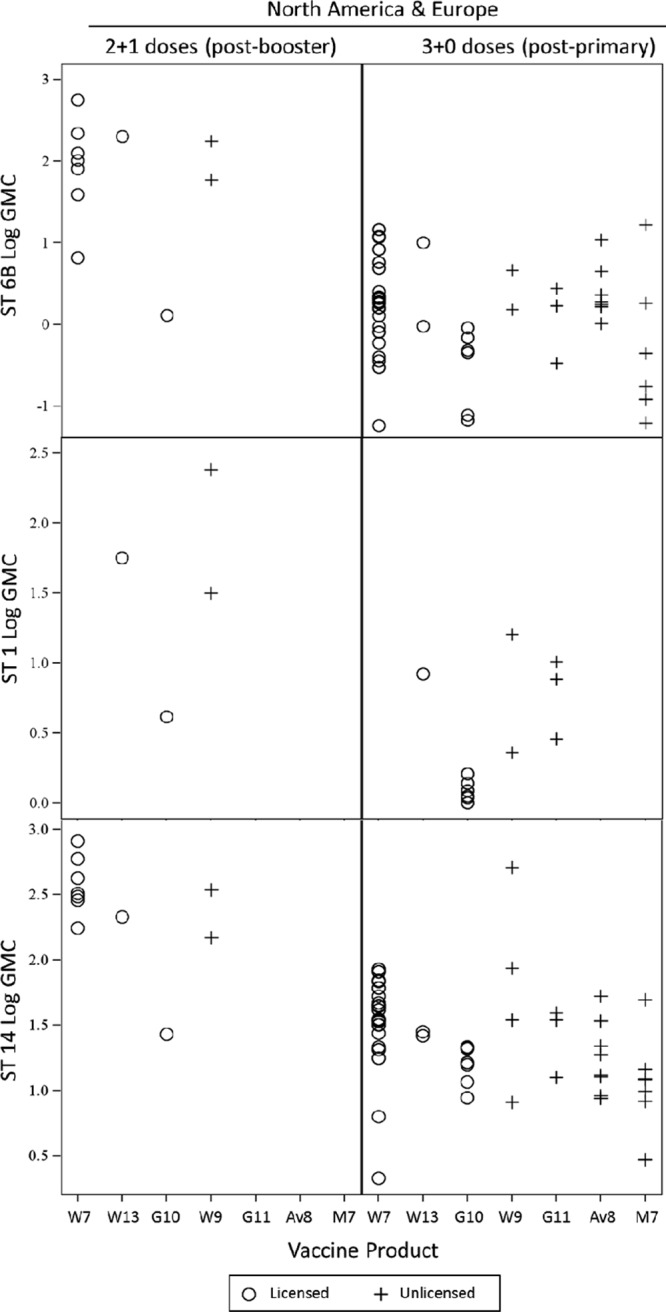
Results: From 61 studies, we evaluated 13 two-dose (2+0) and 65 three-dose primary schedules (3+0) without a booster dose, 11 "2+1" (2 primary plus booster) and 42 "3+1" schedules. The GMC after the primary series was higher following 3-dose schedules compared with 2-dose schedules for all serotypes except for serotype 1. Pre- and postbooster GMCs were generally similar regardless of whether 2 or 3 primary doses were given. GMCs were significantly higher for all serotypes when dose 3 was administered in the second year (2+1) compared with ≤6 months of age (3+0).
Conclusions: While giving the third dose in the second year of life produces a higher antibody response than when given as part of the primary series in the first 6 months, the lower GMC between the 2-dose primary series and booster may result in less disease protection for infants in that interval than those who completed the 3-dose primary series. Theoretical advantages of higher antibodies induced by giving the third dose in the second year of life, such as increased protection against serotype 1 disease, longer duration of protection or more rapid induction of herd effects, need to be evaluated in practice.
Conflict of interest statement
Support for this project was provided by Program for Appropriate Technology in Health (PATH) through funding from the Global Alliance for Vaccines and Immunisation (GAVI). The views expressed by the authors do not necessarily reflect the views of GAVI and/or PATH. M.D.K. has received support from Novartis for participation on a Data and Safety Monitoring Board, meeting travel reimbursement from Pfizer and grant support from Merck. D.G.’s laboratory performs contract and or collaborative research for/with Pfizer, GlaxoSmithKline, Merck, Novartis and Sanofi Pasteur. D.G. has received travel or honorarium support for participation in external expert committees for Merck, Sanofi Pasteur, Pfizer and GlaxoSmithKline. K.O.B. received grant support from Pfizer, GlaxoSmithKline and has received travel or honorarium support for participation in external expert committees for Merck, Aventis-pasteur and GlaxoSmithKline. The authors have no other funding or conflicts of interest to declare.
Figures
References
-
- Liu L, Johnson HL, Cousens S, et al. Child Health Epidemiology Reference Group of WHO and UNICEF. Global, regional, and national causes of child mortality: an updated systematic analysis for 2010 with time trends since 2000. Lancet. 2012;379:2151–2161. - PubMed
-
- World Health Organization and UNICEF. Global immunization data. October 2012 Available at: http://www.who.int/immunization_monitoring/Global_Immunization_Data.pdf. p. 2. Accessed February 4, 2013.
-
- Pilishvili T, Lexau C, Farley MM, et al. Active Bacterial Core Surveillance/Emerging Infections Program Network. Sustained reductions in invasive pneumococcal disease in the era of conjugate vaccine. J Infect Dis. 2010;201:32–41. - PubMed
Publication types
MeSH terms
Substances
LinkOut - more resources
Full Text Sources
Other Literature Sources
Medical
