. 2014 Jan;21(1):64-72.
doi: 10.1038/nsmb.2735. Epub 2013 Dec 15.

Non-CG methylation patterns shape the epigenetic landscape in Arabidopsis

Affiliations

Non-CG methylation patterns shape the epigenetic landscape in Arabidopsis

Hume Stroud et al. Nat Struct Mol Biol. 2014 Jan.

Abstract

DNA methylation occurs in CG and non-CG sequence contexts. Non-CG methylation is abundant in plants and is mediated by CHROMOMETHYLASE (CMT) and DOMAINS REARRANGED METHYLTRANSFERASE (DRM) proteins; however, its roles remain poorly understood. Here we characterize the roles of non-CG methylation in Arabidopsis thaliana. We show that a poorly characterized methyltransferase, CMT2, is a functional methyltransferase in vitro and in vivo. CMT2 preferentially binds histone H3 Lys9 (H3K9) dimethylation and methylates non-CG cytosines that are regulated by H3K9 methylation. We revealed the contributions and redundancies between each non-CG methyltransferase in DNA methylation patterning and in regulating transcription. We also demonstrate extensive dependencies of small-RNA accumulation and H3K9 methylation patterning on non-CG methylation, suggesting self-reinforcing mechanisms between these epigenetic factors. The results suggest that non-CG methylation patterns are critical in shaping the landscapes of histone modification and small noncoding RNA.


Figures

Figure 1
Figure 1
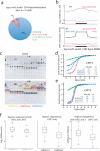
In vitro activity of CMT2. (a) Fractional DNA methylation levels of cytosines in CG, CHG, and CHH contexts across chromosomes. Grey bars indicate pericentromeric heterochromatin. (b) CMT2 in vitro methylation activity on DNA of different methylation status. The values for unmethylated and hemimethylated DNA were normalized according to the number of available (i.e. unmethylated) cytosines. Error bars represent SD for two technical replicates. (c) CMT2 in vitro methylation activity on DNA of different methylation status. Sequence specificities of CMT2 were assessed. Error bars represent SD for two technical replicates.
Figure 2
Figure 2
CMT2 is mediated by H3K9 methylation. (a) Percentages of kyp suvh5 suvh6 CHH hypomethylated 100 bp tiles overlapping with cmt2 and drm1 drm2 CHH hypomethylated tiles. (b) Average distribution of H3K9me2 and CHH methylation over previously defined kyp suvh5 suvh6 CHH hypomethylation DMRs. Middle region represents the DMR and the flanking regions were scaled such that they are the same lengths as the middle region. (c) CMT2 binding assay to different histone modifications on a peptide array. The yellow, red, and blue circles indicate peptides containing mono-, di-, and trimethylated H3K9me2 peptides, respectively. (d) ITC binding curves for complex formation between CMT2 protein and H3K9me3, H3K9me2, H3K9me1, and unmodified H3 peptides. Kd values and the N values are listed as insert. (e) ITC binding curves for CMT3 protein. (f) Normalized H3K9me1 and H3K9me2 ChIP-seq reads in indicated regions are shown. Here and throughout, red lines, median; edges of boxes, 25th (bottom) and 75th (top) percentiles; error bars, minimum and maximum points within 1.5 × interquartile range; red dots, outliers.
Figure 3
Figure 3
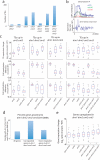
Dissecting contributions of non-CG methyltransferases in DNA methylation patterning. (a) Average distribution of CHG methylation in indicated genotypes over all TEs. TSS= transcription start site; TTS= transcription termination site. (b) Average distribution of CHH methylation in indicated genotypes over all TEs. (c) Heatmaps of CHG methylation levels within drm1 drm2 cmt2 cmt3 CHG hypomethylation DMRs. The columns represent the indicated genotypes, and the rows represent the DMRs. Rows were sorted by complete linkage hierarchical clustering with Euclidean distance as a distance measure. (d) Heatmaps of CHH methylation levels within drm1 drm2 cmt2 cmt3 CHH hypomethylation DMRs. (e) Boxplots of CHG and CHH methylation levels in cmt2 CHH DMRs. (f) Boxplots of CHG and CHH methylation levels in drm1 drm2 CHH DMRs. (g) Genome browser views of CHG and CHH methylation in chromosome 1. Blue bars, TEs; Yellow bars, genes. (h) Boxplots of H3K9me2 levels relative to H3K9me1 in CMT2 target sites and DRM2 target sites. *P=6.5 × 10−224 by two-tailed Wilcoxon rank sum test. (i) Average distributions of H3K9me1 and H3K9me2 levels over long TEs. The log2 ratios of H3K9me1 and H3K9me2 to H3 were plotted over TEs of greater than 2 kilobases in size. Distribution of drm1 drm2 and cmt2 CHH hypomethylation DMRs are also shown for comparison (arbitrary scales).
Figure 4
Figure 4
Non-CG methyltransferases cooperatively silence TEs and genes. (a) Number of TEs defined to be significantly upregulated in indicated genotypes. (b) Distribution of RNA-seq reads in drm1 drm2 cmt2 cmt3 relative to wild type. Wild-type DNA methylation levels are plotted in the top panel to indicate heterochromatic regions. (c) TE expression change in mutant relative to wild type and associated changes in CHG and CHH methylation levels in defined upregulated TEs are plotted. (d) Percentage of genes within one kilobase of drm1 drm2 cmt2 cmt3 CHH hypomethylation DMRs. (e) Protein-coding gene expression levels of genes defined to be upregulated in drm1 drm2 cmt2 cmt3 mutants. *Medians significantly different at a 95% confidence interval. **Medians not different at a 95% confidence interval.
Figure 5
Figure 5
Relationship between non-CG methylation and 24nt-siRNA accumulation. (a) 24ntsiRNA levels in DRM2 target sites. 24nt-siRNA levels were normalized by the counts of 21nt-siRNA levels for each genotype. (b) 24nt-siRNA levels in CMT2 target sites. 24nt-siRNA levels were normalized by the counts of 21nt-siRNA levels for each genotype.
Figure 6
Figure 6
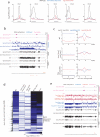
Relationship between non-CG methylation and H3K9 methylation. (a) Distribution of H3K9me2 relative to H3 over chromosomes. The graphs were shifted such that all the graphs aligned on the euchromatic arms. Grey bars indicate pericentromeric heterochromatin. (b) Genome browser views of DNA methylation, expression levels, and H3K9me2 in wild type, drm1 drm2 cmt2 cmt3, and kyp suvh5 suvh6 mutants in chromosome 1. Blue bars, TEs; Yellow bars, genes. (c) Average distribution of H3K9me2 and H3K23ac relative to H3 over cmt2 and drm1 drm2 CHH hypomethylation DMRs. (d) Heatmaps of H3K9me2 levels within drm1 drm2 cmt2 cmt3 mutant CHG hypomethylation DMRs. H3K9me2 was normalized to H3. Two wild-type H3K9me2 data are shown since H3K9me2 data for met1 has a separate wild-type control. (e) Genome browser views of DNA methylation, expression levels, H3K23ac, and H3K9me2 in wild type, drm1 drm2 cmt2 cmt3, and kyp suvh5 suvh6 mutants in chromosome 1. Blue bars, TEs; Yellow bars, genes.
Figure 7
Figure 7
Non-CG methylation pathways. (a) Non-CG methylation pathways at DRM2 target sites. See text for description. (b) Non-CG methylation pathways at CMT2 target sites. See text for description.

References

    1. Law JA, Jacobsen SE. Establishing, maintaining and modifying DNA methylation patterns in plants and animals. Nat Rev Genet. 2010;11:204–220. - PMC - PubMed
    1. Lister R, et al. Human DNA methylomes at base resolution show widespread epigenomic differences. Nature. 2009;462:315–322. - PMC - PubMed
    1. Xie W, et al. Base-resolution analyses of sequence and parent-of-origin dependent DNA methylation in the mouse genome. Cell. 2012;148:816–831. - PMC - PubMed
    1. Laurent L, et al. Dynamic changes in the human methylome during differentiation. Genome Res. 2010;20:320–331. - PMC - PubMed
    1. Meissner A, et al. Reduced representation bisulfite sequencing for comparative high-resolution DNA methylation analysis. Nucleic Acids Res. 2005;33:5868–5877. - PMC - PubMed

Publication types

Associated data