. 2014 Feb;15(2):195-204.
doi: 10.1038/ni.2789. Epub 2013 Dec 15.

Molecular signatures of antibody responses derived from a systems biology study of five human vaccines

Affiliations

Molecular signatures of antibody responses derived from a systems biology study of five human vaccines

Shuzhao Li et al. Nat Immunol. 2014 Feb.

Abstract

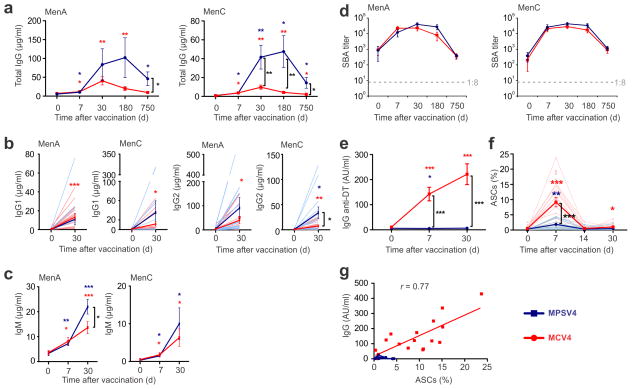
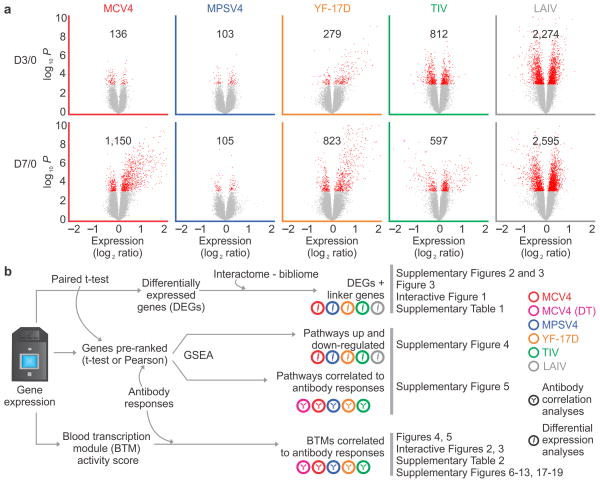
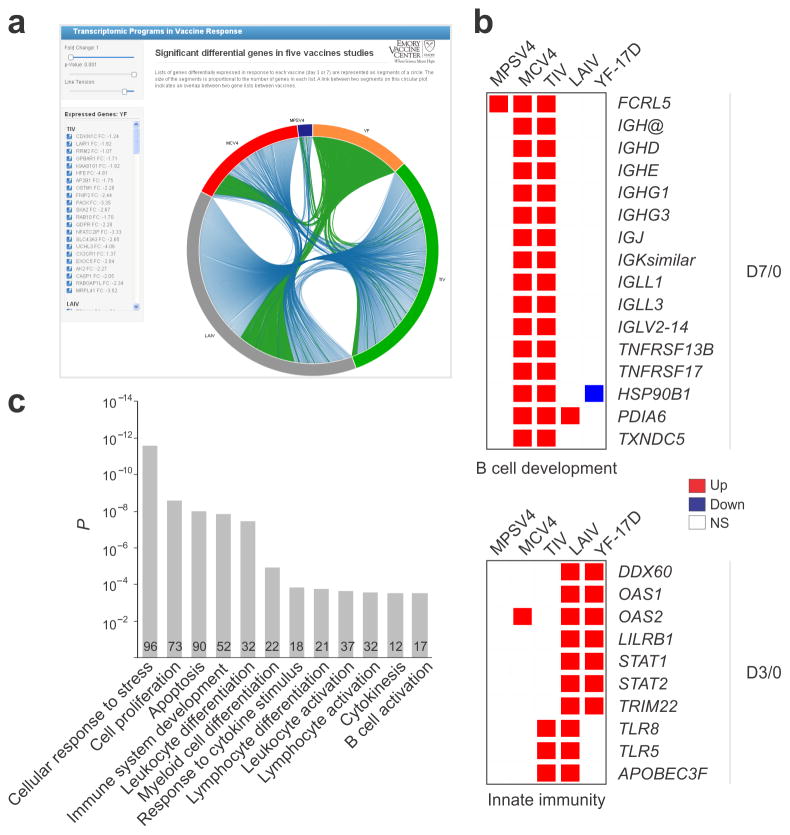
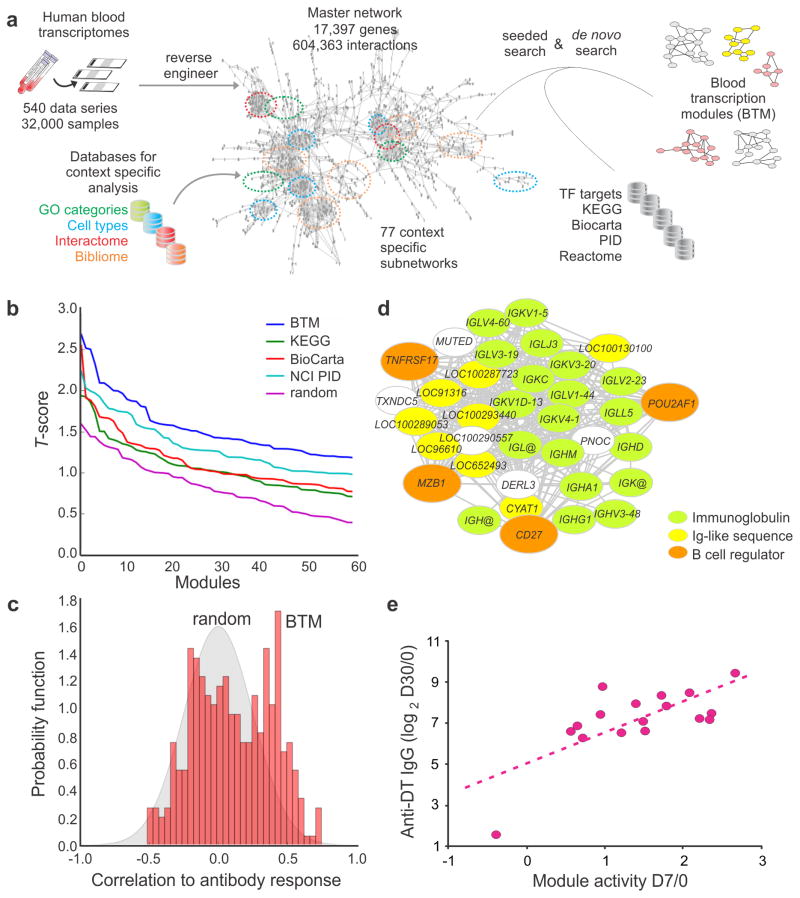
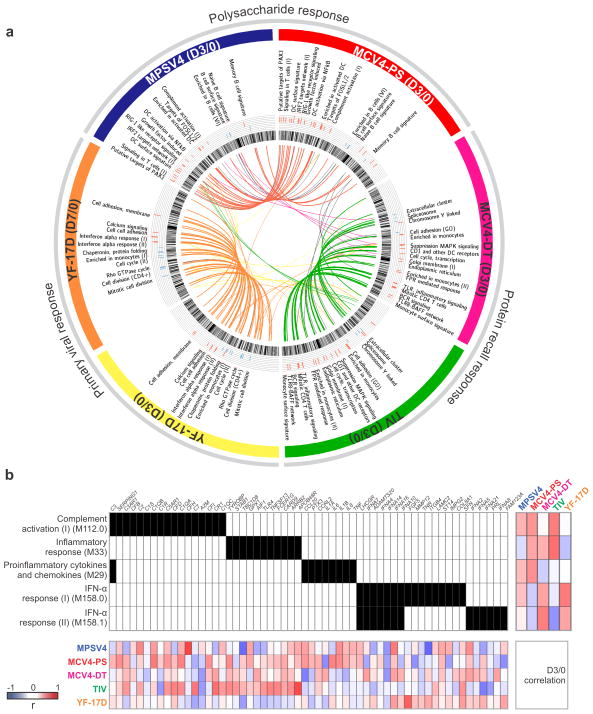
Many vaccines induce protective immunity via antibodies. Systems biology approaches have been used to determine signatures that can be used to predict vaccine-induced immunity in humans, but whether there is a 'universal signature' that can be used to predict antibody responses to any vaccine is unknown. Here we did systems analyses of immune responses to the polysaccharide and conjugate vaccines against meningococcus in healthy adults, in the broader context of published studies of vaccines against yellow fever virus and influenza virus. To achieve this, we did a large-scale network integration of publicly available human blood transcriptomes and systems-scale databases in specific biological contexts and deduced a set of transcription modules in blood. Those modules revealed distinct transcriptional signatures of antibody responses to different classes of vaccines, which provided key insights into primary viral, protein recall and anti-polysaccharide responses. Our results elucidate the early transcriptional programs that orchestrate vaccine immunity in humans and demonstrate the power of integrative network modeling.


Conflict of interest statement

Competing financial interests

The authors declare no competing financial interests.

Figures

Figure 1
Figure 1
Antibody responses of meningococcal vaccinees. Serogroups A and C were measured for total IgG (a), IgG1 and IgG2 (b), IgM (c) and SBA titers (d). (e) A strong IgG response against diphtheria toxoid was detected in MCV4 vaccinees. (f) Antibody secreting cells (ASCs, selected as CD3 CD20 CD38hi CD27hi CD19+ cells) and (g) the number of ASCs at day 7 correlated with diphtheria toxoid-specific serum IgG at day 7. * p<0.05, ** p<0.01, *** p<0.001; unpaired t-test was used for comparisons between vaccine groups, paired t-test was used for comparisons to baseline within a group, Pearson’s correlation was used in (g). All plots show mean values (n=13 for MPSV4 and n=17 for MCV4) from one experiment, error bars as s.e.m.
Figure 2
Figure 2
Analysis of blood transcriptomic data from five human vaccines. (a) Differential expression analysis was performed using paired t-test for each vaccine and each time point (day 3 or day 7 compared to baseline). The red dots in volcano plots show differentially expressed genes (DEGs, p < 0.001), with the numbers of DEGs. (b) A work flow to compare the transcriptomic signatures of five human vaccines.
Figure 3
Figure 3
Differential expression analysis of five vaccines. (a) Online interactive figure showing DEGs shared between vaccine studies (online data portal http://www.immuneprofiling.org/papers/meni/, snapshot of Interactive Fig. 1). Links are shown in blue. When a given vaccine is selected, links are shown in green. (b) Selected DEGs involved in B cell development and innate immunity. (c) The DEGs plus “linker” genes identified by our interactome/bibliome integrative approach and shared by four or more vaccines are enriched with a number of gene ontology categories related to immune system. The genes found in ‘immune system development’ are shown in Supplementary Fig. 4f.
Figure 4
Figure 4
Blood transcription modules provide a sensitive and robust statistical framework. (a) Construction of blood transcription modules (BTM) through large scale data integration. Full details are given in the Supplementary Note. (b) BTMs show superior sensitivity (assessed by t-score) compared to canonical pathways in class comparison. MCV4 transcriptomic data at D3/0 are used as example. Additional examples can be found in Supplementary Fig. 9. (c) Assessing the statistical significance of BTM correlation to antibody data. Each module is collapsed to a single activity score (mean value of all member genes), and Pearson correlation to antibody data is calculated across all subjects (red bars). The gray area is the distribution of random data generated by permutations of module gene memberships and sample labels. Data shown is the D3/0 MCV4 transcriptome data. (d) BTM module M156.1 consists of mostly immunoglobulin genes. Each edge represents a coexpression relationship learned from public data. CD27, TNFRSF17 and MZB1 are known B cell regulators, and POU2AF1 is a regulator of TNFRSF17. (e) Correlation of module M156.1 activity and later antibody response (MCV4-DT).
Figure 5
Figure 5
BTM analysis reveals distinct mechanisms of antibody response. (a) Each vaccine data set is shown as one of six segments on the circular plot. In each segment, the inner circular bands show an ordered list of all BTM modules, layered by histograms of modules significantly correlated to the antibody response, red for positive correlation and blue for negative correlation. Significant modules that are common between vaccines (as in Supplementary Fig. 12b, c, d) are linked by a color curve in the center (gray links for modules omitted in Supplementary Figure 11). An interactive version of this figure is available (online data portal, Interactive Figure 2). (b) Illustration of module activity. A filled unit in the center grid indicates the membership of the gene (top axis) in the corresponding module (left axis). The heat map on the right shows the Pearson correlation between module activity and antibody response in each study. The bottom heat map shows correlation between module member genes and the antibody response.
Figure 6
Figure 6
The meningococcal polysaccharide vaccine activates myeloid dendritic cells. (a) Induction of cytokines by MPSV4 from human myeloid DC (4 independent replicates) and monocyte derived DC (6 independent replicates). Mean values of independent replicates are shown, error bars as s.e.m. Secreted IL-6 protein levels are shown but the same result was observed for TNF and IL-12p40 levels. (b) Mouse knockout DCs show that the MPSV4 stimulation is dependent on Myd88, Trif, Tlr4 and Asc in vitro. CD11c+ DCs were isolated by MACS from spleens of C57BL/6 mice (WT) or various knock-out mice and stimulated for 24 h; *p<0.05, ***p<0.0001, unpaired t-test was used to compare WT vs. KO. Four independent replicates were performed for Myd88, Trif and Tlr4 knockouts, six for Asc knockouts. One representative experiment is shown, with mean values and s.e.m. from technical replicates.

Comment in

References

    1. Pulendran B. Learning immunology from the yellow fever vaccine: innate immunity to systems vaccinology. Nature Reviews Immunology. 2009;9:741–747. - PubMed
    1. Pulendran B, Li S, Nakaya HI. Systems vaccinology. Immunity. 2010;33:516–529. - PMC - PubMed
    1. Nakaya HI, Pulendran B. Systems vaccinology: its promise and challenge for HIV vaccine development. Current Opinion in HIV and AIDS. 2012;7:24. - PMC - PubMed
    1. Querec TD, et al. Systems biology approach predicts immunogenicity of the yellow fever vaccine in humans. Nature immunology. 2008;10:116–125. - PMC - PubMed
    1. Gaucher D, et al. Yellow fever vaccine induces integrated multilineage and polyfunctional immune responses. The Journal of experimental medicine. 2008;205:3119–3131. - PMC - PubMed

Publication types

MeSH terms

Associated data