. 2014 Jan;20(1):75-9.
doi: 10.1038/nm.3412. Epub 2013 Dec 15.

Sterilization of granulomas is common in active and latent tuberculosis despite within-host variability in bacterial killing

Affiliations

Sterilization of granulomas is common in active and latent tuberculosis despite within-host variability in bacterial killing

Philana Ling Lin et al. Nat Med. 2014 Jan.

Abstract

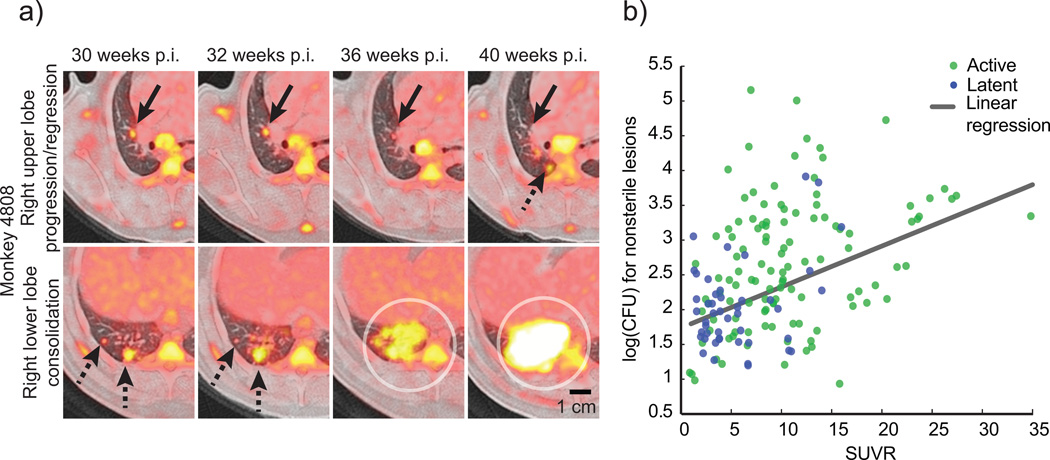
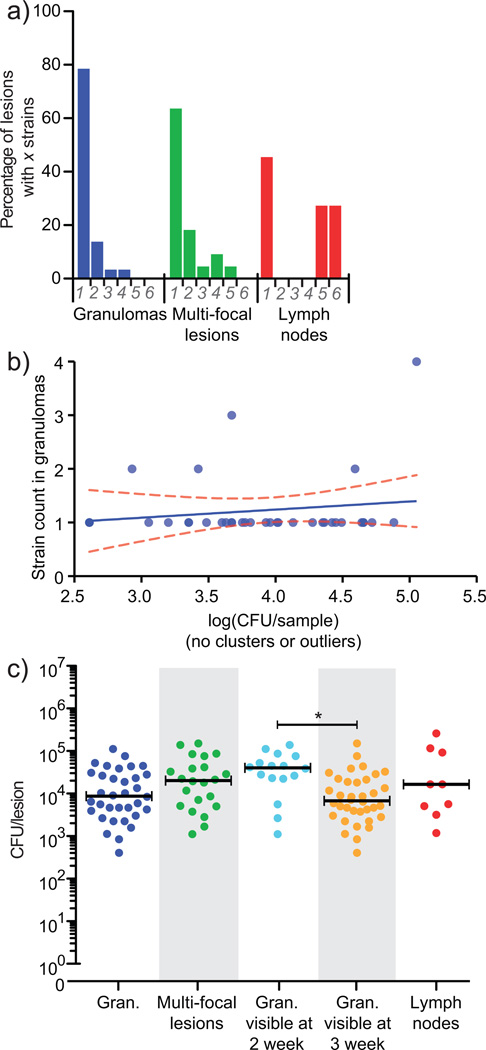
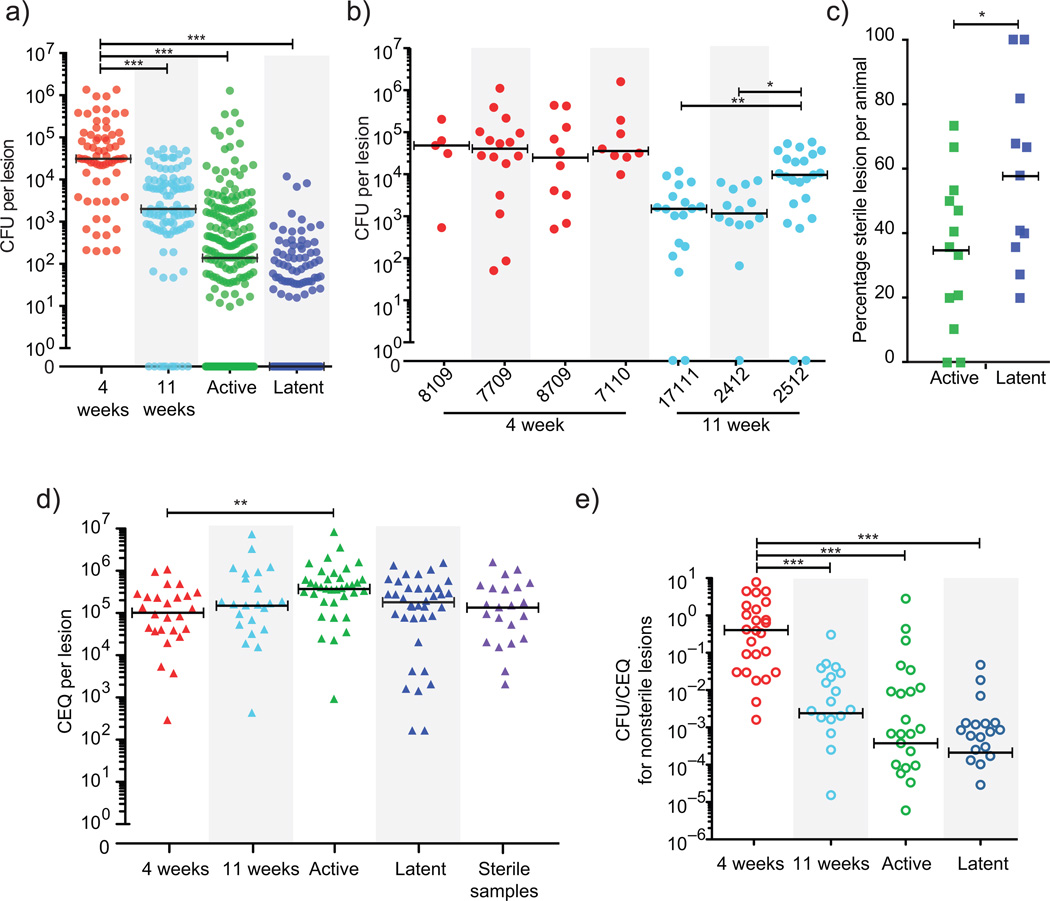
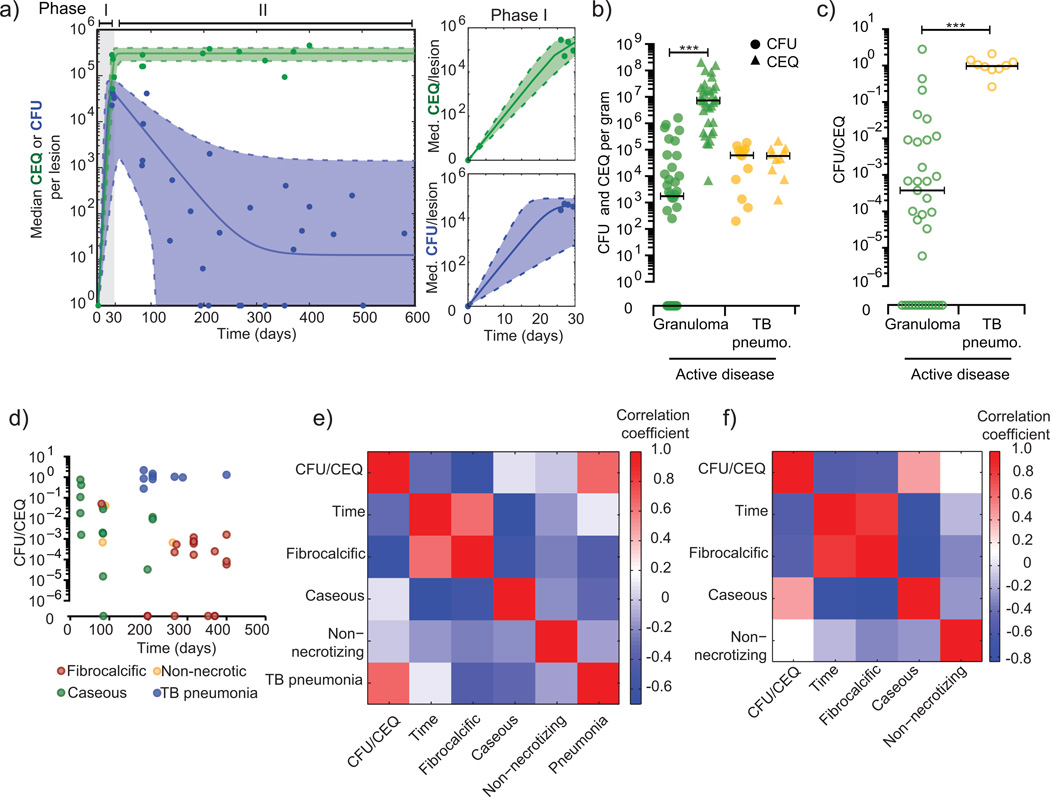
Over 30% of the world's population is infected with Mycobacterium tuberculosis (Mtb), yet only ∼5-10% will develop clinical disease. Despite considerable effort, researchers understand little about what distinguishes individuals whose infection progresses to active tuberculosis (TB) from those whose infection remains latent for decades. The variable course of disease is recapitulated in cynomolgus macaques infected with Mtb. Active disease occurs in ∼45% of infected macaques and is defined by clinical, microbiologic and immunologic signs, whereas the remaining infected animals are clinically asymptomatic. Here, we use individually marked Mtb isolates and quantitative measures of culturable and cumulative bacterial burden to show that most lung lesions are probably founded by a single bacterium and reach similar maximum burdens. Despite this observation, the fate of individual lesions varies substantially within the same host. Notably, in active disease, the host sterilizes some lesions even while others progress. Our data suggest that lesional heterogeneity arises, in part, through differential killing of bacteria after the onset of adaptive immunity. Thus, individual lesions follow diverse and overlapping trajectories, suggesting that critical responses occur at a lesional level to ultimately determine the clinical outcome of infection. Defining the local factors that dictate outcome will be useful in developing effective interventions to prevent active TB.


Figures

Figure 1
Figure 1. Serial imaging reveals the dynamic evolution of lesions in TB
(a) A PET/CT image of progressing and regressing lesions is shown from the same animal that developed active disease following low dose infection. Serial PET/CTs reveal a resolving lesion in the right upper lobe (upper panel, solid black arrows) at the same time that new lesions appear (dashed black arrow). In the right lower lobe (lower panel), lesions progress (dashed black arrows) and new lesions coalesce to form a consolidation (circles). (b) 18-FDG avidity (SUVR) is positively correlated with bacterial numbers in lesions (Spearman’s • = 0.4431), though there is considerable variability in both. A linear regression model of SUVR vs. CFU reveals significant predictive value (slope = 0.05847 +/− 0.009730, p < 0.001). Symbols represent individual lesions (n = 274) from active (green, n = 15) or latent (blue, n = 10) monkeys.
Figure 2
Figure 2. The majority of lesions in monkeys are initiated by a single bacterium
(a) 79% of granulomas (n = 37) contained a single barcode, although all eight barcodes were represented in each animal. When multi-focal lesions (lesions with histologic evidence of being comprised of two or more granulomas, n = 22) were analyzed separately, many (64%) contained only a single barcode, suggesting these lesions arose through localized spreading as opposed to coalescence of nearby lesions. In contrast, thoracic lymph nodes contained as many as six barcodes (n = 13), reflecting draining of infecting bacilli from lungs to lymph nodes. Bacterial load was similar in these two animals to the four other animals analyzed at 4 weeks post-infection (Supplemental Figure 1b). (b) A linear regression of total bacterial load in individual granulomas (n=37) indicates no relationship between CFU and the number of barcodes recovered, such that initial bacterial load did not influence later bacterial load (Spearman’s • = 0.2404, slope = 0.1510 +/− 0.1919, p = 0.4372, Kruskal-Wallis, p = 0.1120). (c) A range of bacterial load per lesion is present in individual lesions, in clustered lesions, and lymph nodes. Bacterial load in lesions visible at 2 weeks p.i. by PET-CT (n = 16) is significantly higher than those not visible until 3 weeks (n = 36, p < 0.05), with substantial overlap, suggesting that the timing of lesion formation can affect bacterial burden. Bars represent medians.
Figure 3
Figure 3. CFU and CEQ reflect viable and total bacterial burden in individual lesions
(a) CFU in lesions from monkeys at 4 weeks (4 animals, 68 lesions) is significantly higher than at 11 weeks (3 animals, 98 lesions), in active disease (13 animals, 222 lesions) and in clinically latent infection (11 animals, 145 lesions) (p < 0.001). All groups are significantly different by pairwise comparison (p < 0.001). Circles represent individual lesions. The median for latent animals is zero. (b) Individual monkeys necropsied at 4 weeks and 11 weeks are shown; circles represent individual lesions. By 11 weeks, there are significant differences between animals (p < 0.05). (c) The percentage of sterile lesions in monkeys with latent infection (n = 11) is significantly higher than in monkeys with active disease (n = 13, p < 0.05); however in both conditions the majority of animals contain sterile lesions. Squares represent individual animals. (d) CEQ per lesion is similar across all categories (n = 26 for 4 week, n = 23 for 11 week, n = 36 for active, n = 37 for latent). CEQ from lesions of active monkeys was significantly higher compared to 4 weeks p.i. reflecting additional replication. CEQ is also similar in sterile lesions (n = 22), supporting the observation that CEQ are stable in the absence of replication. Triangles represent individual lesions. (e) The ratio of CFU to CEQ in individual non-sterile lesions drops significantly after 4 weeks (n = 26), indicating bacterial killing over time (n = 22 for 11 week animals, n = 29 for active, n = 28 for latent), coincident with the onset of the adaptive immune response (p < 0.001). Open circles represent individual lesions. For all panels, *p < 0.05, **p < 0.01,***p < 0.001, statistical tests as indicated in Methods, bars represent medians.
Figure 4
Figure 4. Models and correlates of replication and killing
(a) Median CEQ (green) and CFU (blue) were fit with ordinary differential equations describing growth and death in individual lesions. t0 data were inferred from our barcode data suggesting most granulomas start with a single bacterium. CFU data were modeled as two phases – phase I represents initial growth (t = 0:30 days); phase II represents a subsequent killing (t = 30:600 days). Doubling times in individual lesions were inferred from CEQ and CFU fitted curves (Supplemental Table 3). Phase I is shown in detail in panels on the right, and validated against 3 week CFU samples in Supplemental Figure 3. (b) CFU (circles) and CEQ (triangles) per gram of tissue are shown for granulomas from active disease animals or sites with TB pneumonia. (c) The ratio of CFU/gm to CEQ/gm in TB pneumonia samples suggests reduced killing at these sites. (d) Plotting time, histopathology, and CFU/CEQ reveals associations between these variables. (e) A correlation matrix reveals that the characteristics TB pneumonia (r = 0.66, p = 9.24E-07) and fibrocalcific (r = −0.62, p = 6.95E-06) are significantly correlated with CFU/CEQ, though to opposite effect. TB pneumonia is positively correlated with CFU/CEQ (i.e. little killing), and poorly correlated with time. Both fibrocalcific and caseous lesions are correlated with time p.i. (f) We removed TB pneumonia samples from the analysis to focus on granulomatous sites. Time is significantly correlated with CFU/CEQ (r = −0.53, p = 0.001), suggesting that killing increases over time in these lesions and the dominant histopathology switches from caseous to fibrocalcific.

References

    1. Zumla A, Raviglione M, Hafner R, von Reyn CF. Tuberculosis. N Engl J Med. 2013;368:745–755. - PubMed
    1. Lin PL, et al. Quantitative comparison of active and latent tuberculosis in the cynomolgus macaque model. Infect Immun. 2009;77:4631–4642. - PMC - PubMed
    1. Capuano SV, 3rd, et al. Experimental Mycobacterium tuberculosis infection of cynomolgus macaques closely resembles the various manifestations of human M. tuberculosis infection. Infect Immun. 2003;71:5831–5844. - PMC - PubMed
    1. Barry CE, 3rd, et al. The spectrum of latent tuberculosis: rethinking the biology and intervention strategies. Nat Rev Microbiol. 2009;7:845–855. - PMC - PubMed
    1. Lin PL, Flynn JL. Understanding latent tuberculosis: a moving target. J Immunol. 2010;185:15–22. - PMC - PubMed

Online References

    1. Lin PL, et al. Radiologic responses in cynomolgus macaques fro assessing tuberculosis chemotherapy regimens. Submitted for publication. 2013 - PMC - PubMed
    1. Kennedy HE, Vandiviere HM, Willis HS. The effects of extended incubation on propagability of tubercle bacilli. Am Rev Tuberc. 1958;77:802–814. - PubMed
    1. Vandiviere HM, Loring WE, Melvin I, Willis S. The treated pulmonary lesion and its tubercle bacillus. II. The death and resurrection. Am J Med Sci. 1956;232:30–37. passim. - PubMed
    1. Keane J, et al. Tuberculosis associated with infliximab, a tumor necrosis factor alpha-neutralizing agent. N Engl J Med. 2001;345:1098–1104. - PubMed

Publication types