. 2014 Jan;32(1):92-6.
doi: 10.1038/nbt.2776. Epub 2013 Dec 15.

Genome-wide localization of small molecules

Affiliations

Genome-wide localization of small molecules

Lars Anders et al. Nat Biotechnol. 2014 Jan.

Abstract

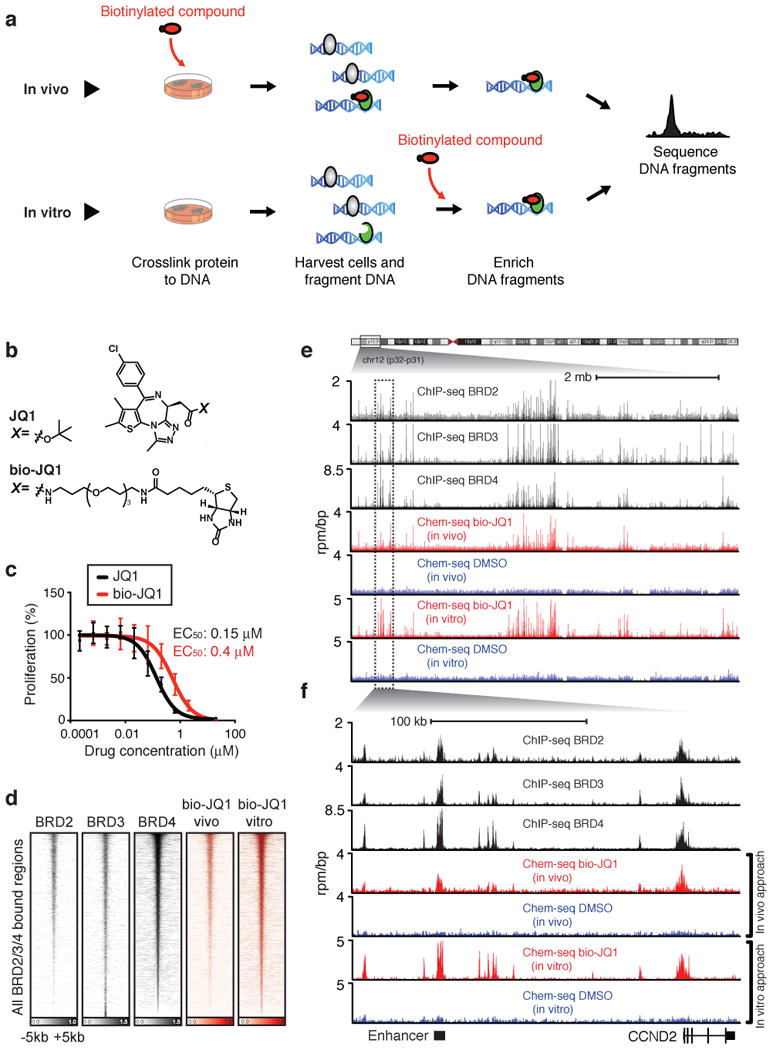
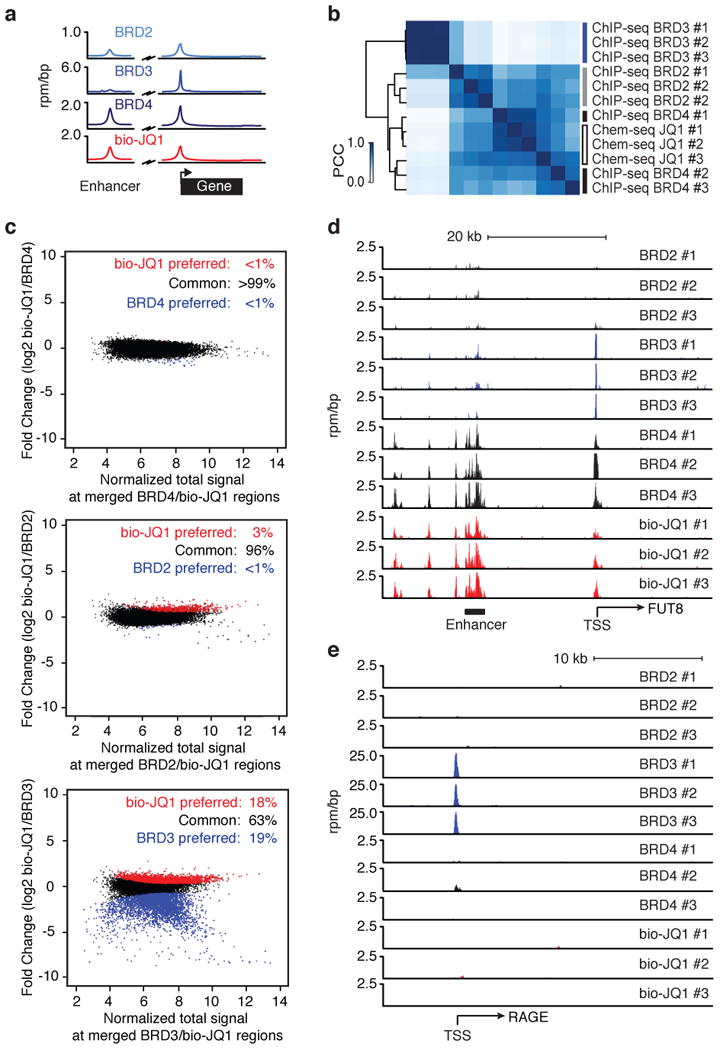
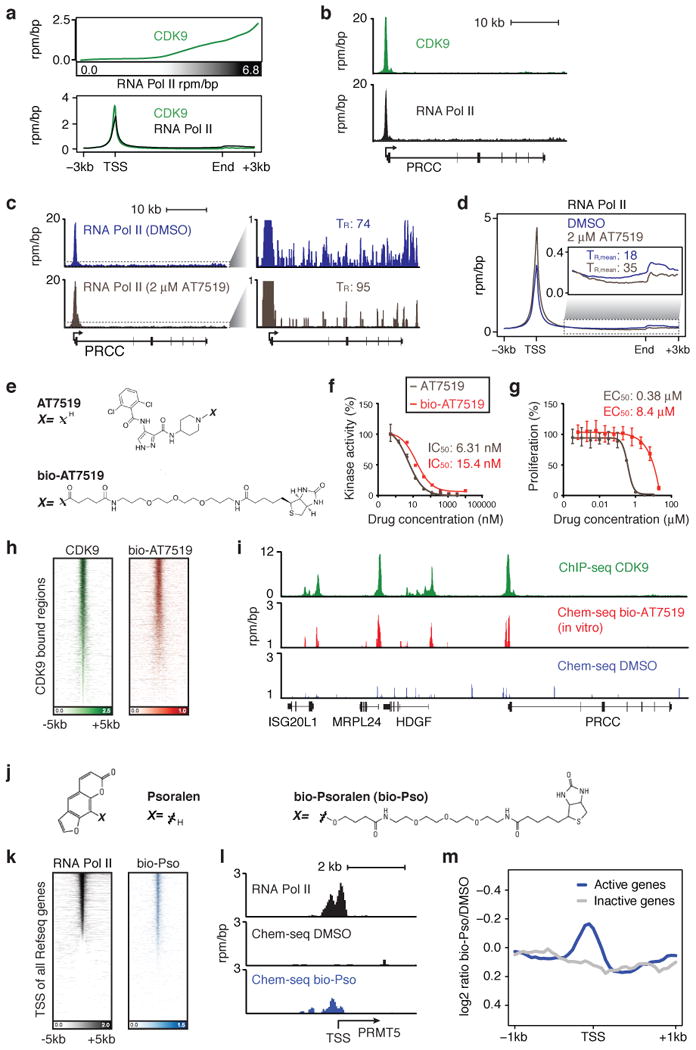
A vast number of small-molecule ligands, including therapeutic drugs under development and in clinical use, elicit their effects by binding specific proteins associated with the genome. An ability to map the direct interactions of a chemical entity with chromatin genome-wide could provide important insights into chemical perturbation of cellular function. Here we describe a method that couples ligand-affinity capture and massively parallel DNA sequencing (Chem-seq) to identify the sites bound by small chemical molecules throughout the human genome. We show how Chem-seq can be combined with ChIP-seq to gain unique insights into the interaction of drugs with their target proteins throughout the genome of tumor cells. These methods will be broadly useful to enhance understanding of therapeutic action and to characterize the specificity of chemical entities that interact with DNA or genome-associated proteins.


Figures

Figure 1
Figure 1
Chem-seq from intact cells or cellular lysates reveals genomic sites bound by the BET bromodomain-targeting drug JQ1. (a) Features of the Chem-seq method in living cells (in vivo, top) and cell lysates (in vitro, bottom). Top (in vivo): cells are treated with a biotinylated drug to allow drug-target binding to take place in the cellular context. Formaldehyde treatment cross-links chromatin-associated proteins to DNA, including drug-target complexes associated with chromatin. Following cell lysis and sonication, DNA fragments bound to the drug-target complex are enriched using streptavidin beads. Sequencing of the enriched DNA fragments permits genome-wide identification of the loci to which the drug target binds. Bottom (in vitro): the biotinylated drug is added to the cell extract, where it binds protein-DNA complexes. Enrichment of DNA fragments and sequencing is carried out as in the in vivo method. (b) Chemical structures of JQ1 and its biotinylated version, bio-JQ1. (c) Effect of JQ1 (black) and bio-JQ1 (red) on MM1.S cell proliferation. Cells were treated with varying concentrations of drug for 72 h. (d) Heatmap representation of binding of the individual BET proteins (ChIP-seq, black) and bio-JQ1 (in vivo and in vitro Chem-seq, red) to the union of all 25,450 regions occupied by BRD2, BRD3, BRD4 and bio-JQ1. Read density surrounds the center (±5kb) of all occupied regions, rank ordered from highest to lowest BRD4 occupancy. (e) Gene tracks showing BRD2, 3, 4 and bio-JQ1 occupancy of a region of chromosome 12. ChIP-seq reads for BRD2, 3 and 4 (black), Chem-seq reads for biotinylated JQ1 (bio-JQ1, red) or DMSO vehicle control (blue) are shown. The genome-wide data is plotted in reads per million per base pair (rpm/bp). (f) Close-up view of gene tracks showing BRD2, 3 and 4 occupancy (ChIP-seq) and bio-JQ1 occupancy (Chem-seq) across the CCND2 gene locus.
Figure 2
Figure 2
Genome-wide drug target analysis. (a) Genome-wide binding averages of BRD2, BRD3, BRD4 (ChIP-seq) and bio-JQ1 (in vitro Chem-seq) on active enhancers, active promoters and gene bodies in MM1.S cells. (b) Heatmap showing the similarity of signal distribution between bio-JQ1 (in vitro Chem-seq) and BET bromodomain proteins BRD2, 3 and 4 (ChIP-seq) by Pearson correlation at 25,693 genomic regions bound by BET proteins and bio-JQ1. Blue reflects high similarity of signal between of each pair of factors. Factors are arranged and clustered along both axes based on the distance calculated from Pearson correlation. ChIP-seq and Chem-seq data for each factor were generated from three independent experiments. (c) Differential occupancy analysis of bioJQ1 (in vitro Chem-seq) and either BET bromodomain protein (ChIP-seq). The log ratios of normalized bio-JQ1 in vitro Chem-seq signal to BRD ChIP-seq signal are plotted for genomic regions identified as enriched for the presence of bio-JQ1 or either BRD protein. Triplicate ChIP-seq or Chem-seq datasets were used for each calculation. (d) Gene tracks showing the FUT8 enhancer, a site identified as bio-JQ1 high/BRD3 low region identified in (b, lower panel, red). Triplicate datasets were generated for each factor. (e) Gene tracks surrounding the transcriptional start site (TSS) of the PAGE gene, a ‘BRD3 preferred region’ (BRD3 high/bio-JQ1 low) identified in (b, lower panel, blue).
Figure 3
Figure 3
Chem-seq reveals genomic occupancy of a protein kinase inhibitor and a DNA-intercalating drug. (a) Upper panel: CDK9 occupancy is correlated with the RNA pol II at promoters in MM1.S cells. Median CDK9 signal at promoters is ranked by increasing RNA pol II occupancy. Signals are shown in units of reads per million mapped reads per base pair (rpm/bp). Promoters were binned (50/bin) and a smoothing function was applied to median signals. Lower panel: genome-wide binding averages of CDK9 and RNA pol II on active promoters and gene bodies in MM1.S cells as determined by ChIP-seq analysis. (b) Gene tracks showing occupancy of the PRCC gene by CDK9 and RNA pol II based on ChIP-seq data. (c) Effect of AT7519 treatment on RNA pol II occupancy at the PRCC gene. MM1.S cells were treated with either DMSO vehicle (blue) or 2 μM AT7519 (brown) for 6 h, followed by RNA pol II ChIP-seq analysis. Twenty-fold magnifications of the rpm/bp scale of these gene tracks are shown in the right panel to show the difference in reads for elongating RNA pol II. TR, RNA pol II traveling ratio. (d) Genome-wide binding average RNA pol II (ChIP-seq) on active promoters and gene bodies following treatment of MM1.S cells with DMSO vehicle (blue) or 2 μM of AT7519 (brown) for 6 h. Magnification of the rpm/bp scale at gene bodies is shown in the inset. The inset includes RNA polymerase II traveling ratio distributions (TR, mean) derived from MM1.S cells treated with DMSO (blue) or 2 μM AT7519 (red). (e) Chemical structures of the pan-CDK inhibitor AT7519 and its biotinylated counterpart bio-AT7519. (f) In vitro kinase assays with recombinant cyclin T-CDK9 complex in the presence of increasing concentrations of AT7519 or bio-AT7519. The derived IC50 values for each compound are shown. (g) Effect of AT7519 and bio-AT7519 on MM1.S cell proliferation. Cells were treated with varying concentrations of drug for 72 h as indicated. The derived EC50 values for each compound are shown. (h) Heatmap representation of CDK9 (ChIP-seq, green) and bio-AT7519 binding (in vitro Chem-seq, red) to all CDK9 occupied regions, rank ordered from highest to lowest CDK9 occupancy. Read density surrounds the center (± 5kb) of all occupied regions. (i) Gene tracks showing occupancy of the PRCC gene locus by bio-AT7519 (red) and DMSO (vehicle, blue) as assessed by in vitro Chem-seq analysis, and by CDK9 (ChIP-seq, green). (j) Chemical structures of psoralen and biotinylated psoralen. (k) Heatmap representation of RNA pol II (ChIP-seq, black) and bio-psoralen binding (in vivo Chem-seq, light blue) to all human Refseq genes, rank ordered from highest to lowest RNA pol II occupancy. Read density surrounds the center (± 5kb) of occupied regions. (l) Gene tracks centered at the TSS of the PRMT5 gene, showing occupancy of bio-psoralen (middle panel, light blue) versus DMSO (upper panel) as revealed by in vivo Chem-seq analysis, together with RNA pol II ChIP-seq data (lower panel, black). (m) Metagene representation of bio-psoralen in vivo Chem-seq data at ±1kb around the TSS of active (light blue) and inactive (grey) genes. Log2 ratio of the mean bio-psoralen Chem-seq signal to mean DMSO signal in 50bp bins is plotted at the x-axis.

Similar articles

Cited by

References

    1. Bell O, Tiwari VK, Thoma NH, Schubeler D. Determinants and dynamics of genome accessibility. Nat Rev Genet. 2011;12:554–564. - PubMed
    1. Gilbert DM. Evaluating genome-scale approaches to eukaryotic DNA replication. Nat Rev Genet. 2010;11:673–684. - PMC - PubMed
    1. Hawkins RD, Hon GC, Ren B. Next-generation genomics: an integrative approach. Nat Rev Genet. 2010;11:476–486. - PMC - PubMed
    1. MacQuarrie KL, Fong AP, Morse RH, Tapscott SJ. Genome-wide transcription factor binding: beyond direct target regulation. Trends Genet. 2011;27:141–148. - PMC - PubMed
    1. Neph S, et al. Circuitry and dynamics of human transcription factor regulatory networks. Cell. 2012;150:1274–1286. - PMC - PubMed

Publication types