. 2014 Feb;25(4):431-40.
doi: 10.1091/mbc.E13-06-0319. Epub 2013 Dec 11.

Deficiency of the BiP cochaperone ERdj4 causes constitutive endoplasmic reticulum stress and metabolic defects

Affiliations

Deficiency of the BiP cochaperone ERdj4 causes constitutive endoplasmic reticulum stress and metabolic defects

Jill M Fritz et al. Mol Biol Cell. 2014 Feb.

Abstract

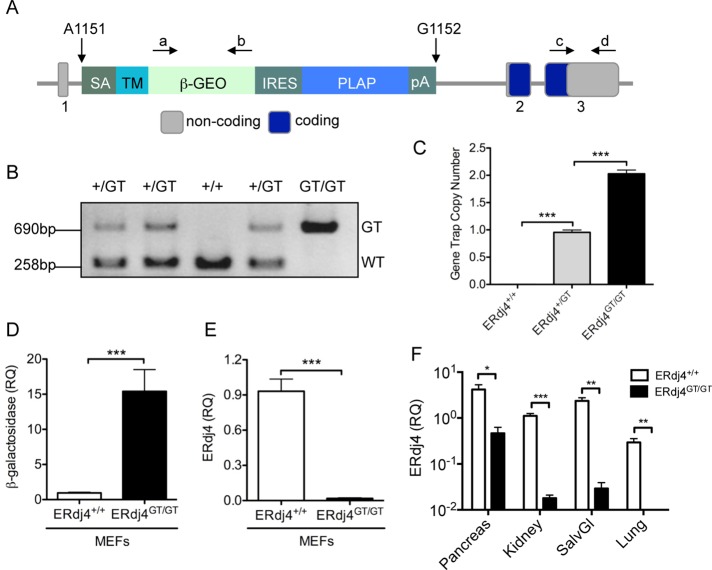
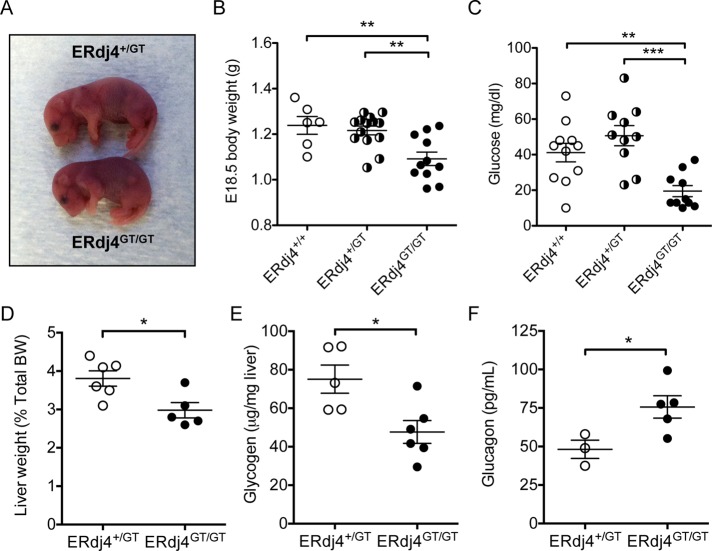
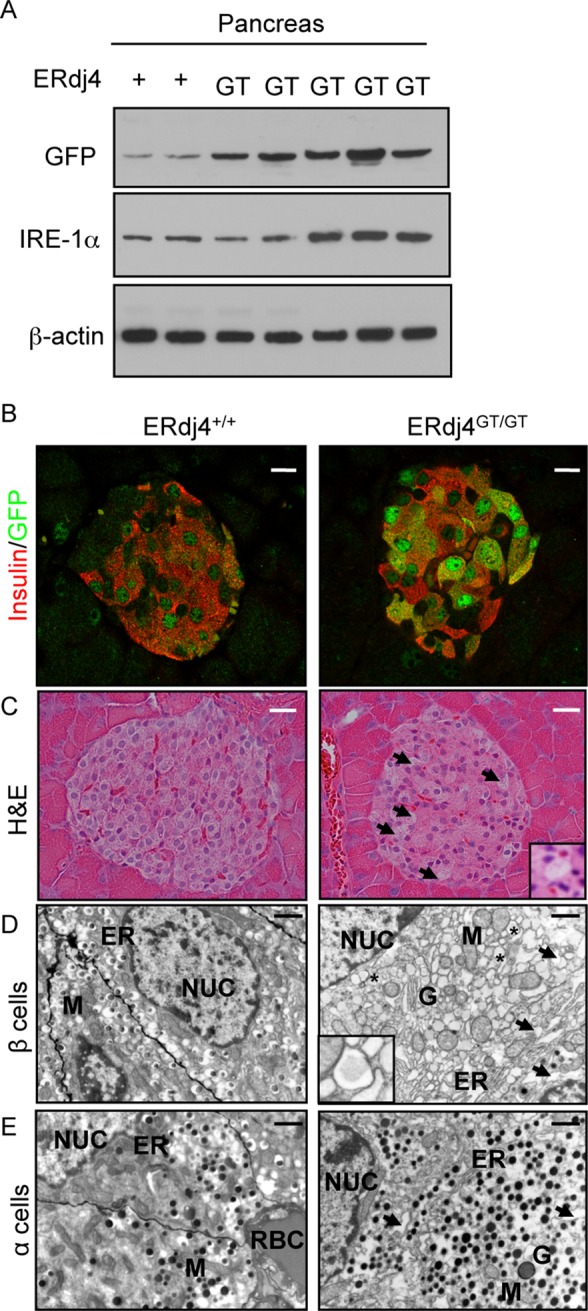
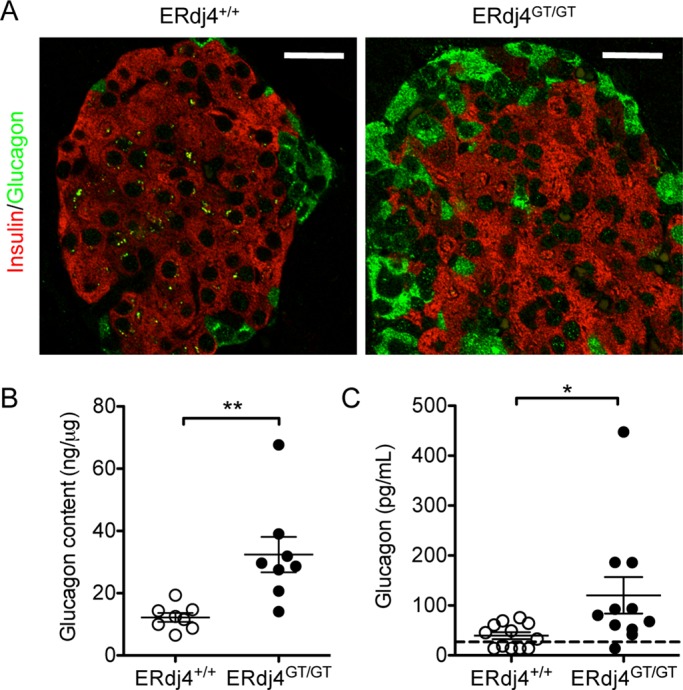
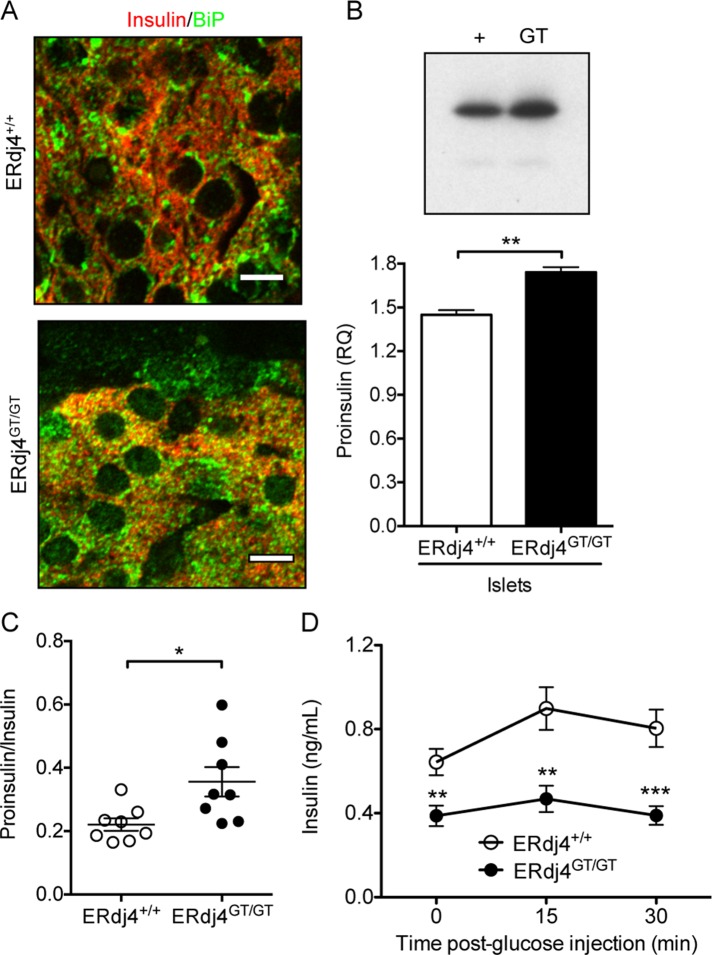
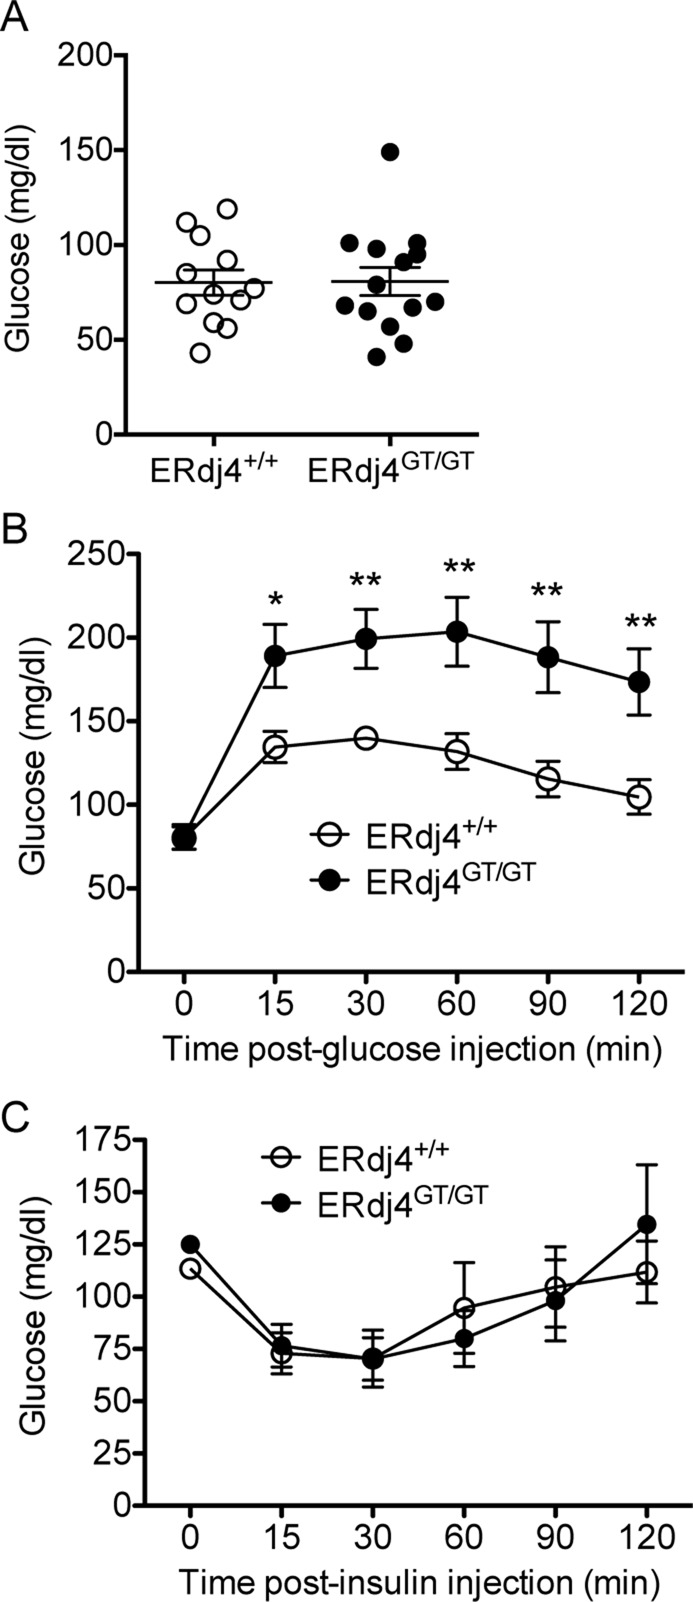
Endoplasmic reticulum-localized DnaJ 4 (ERdj4) is an immunoglobulin-binding protein (BiP) cochaperone and component of the endoplasmic reticulum-associated degradation (ERAD) pathway that functions to remove unfolded/misfolded substrates from the ER lumen under conditions of ER stress. To elucidate the function of ERdj4 in vivo, we disrupted the ERdj4 locus using gene trap (GT) mutagenesis, leading to hypomorphic expression of ERdj4 in mice homozygous for the trapped allele (ERdj4(GT/GT)). Approximately half of ERdj4(GT/GT) mice died perinatally associated with fetal growth restriction, reduced hepatic glycogen stores, and hypoglycemia. Surviving adult mice exhibited evidence of constitutive ER stress in multiple cells/tissues, including fibroblasts, lung, kidney, salivary gland, and pancreas. Elevated ER stress in pancreatic β cells of ERdj4(GT/GT) mice was associated with β cell loss, hypoinsulinemia, and glucose intolerance. Collectively these results suggest an important role for ERdj4 in maintaining ER homeostasis during normal fetal growth and postnatal adaptation to metabolic stress.


Figures

FIGURE 1:
FIGURE 1:
Generation of ERdj4GT/GT mice. (A) The GT allele. The GT cassette was inserted between adenosine 1151 and guanosine 1152 within intron 1 of the ERdj4 locus (NC_000078.6). Quantitative RT (qRT)-PCR was performed using primers specific for β-galactosidase (a, b) and ERdj4 (c, d). β-GEO, β-galactosidase/neomycin resistance fusion gene; IRES, internal ribosome entry site; pA, polyadenylation signal; PLAP, placental alkaline phosphatase; SA, splicing acceptor; TM, transmembrane region. (B) PCR genotyping of the WT and GT alleles in gDNA isolated from the progeny of heterozygous intercrosses. (C) GT copy number was determined in gDNA by the TaqMan Gene Copy Number assay. n = 4 mice/genotype. (D, E) qRT-PCR of β-galactosidase and ERdj4 mRNAs in MEFs. RQ, relative quantitation. n = 3 samples/group. (F) qRT-PCR of ERdj4 mRNA in tissues isolated from 6-wk-old littermates; samples were normalized to β-actin. n = 4 mice/genotype.
FIGURE 2:
FIGURE 2:
Fetal growth retardation and neonatal hypoglycemia in ERdj4GT/GT mice. (A) Size comparison of E18.5 embryos. (B) Body weights of E18.5 embryos. n = 6–14 mice/genotype. (C) Blood glucose levels of vaginally born or cesarean-delivered, nonsuckling neonates. n = 10–11 mice/genotype. (D) Liver weights of neonatal mice. BW, body weight. n = 5–6 mice/genotype. (E) Liver glycogen in neonatal mice. n = 5–6 mice/genotype. (F) Plasma glucagon in neonatal mice. n = 3–5 mice/genotype.
FIGURE 3:
FIGURE 3:
Elevated ER stress in the endocrine pancreas of ERdj4GT/GT mice. (A) Western blot analyses of GFP (reporter for XBP1 splicing), IRE1α, and β-actin (loading control) proteins in pancreatic homogenates from 6-wk-old ERdj4+/+ERAI (n = 2) and ERdj4GT/GTERAI (n = 5) mice. (B) Confocal microscopy of insulin (red) and GFP (green) proteins in pancreatic tissue sections from 8-wk-old ERdj4+/+ERAI (left) and ERdj4GT/GTERAI (right) mice. Scale bars, 10 μm. n = 4–5 mice/genotype. (C) Hematoxylin and eosin (H&E) staining of pancreatic tissue sections from 16- to 20-wk-old mice. Note the vacuolated cells in the islets of ERdj4GT/GT mice (arrows and inset). Scale bars, 10 μm. n = 5 mice/genotype. (D) Electron microscopy of β cells in pancreatic islets of 6-wk-old mice. Note the pronounced ER dilation (arrows) and electron-translucent secretory granules (asterisks and inset) in β cells of ERdj4GT/GT mice. Scale bars, 2 μm. n = 2 mice/genotype. ER, endoplasmic reticulum; G, Golgi complex; M, mitochondria; NUC, nucleus. (E) Electron microscopy of α cells in pancreatic islets of 6-wk-old mice. Note the pronounced ER dilation (arrows) in α cells of ERdj4GT/GT mice. Scale bars, 2 μm. n = 2 mice/genotype. ER, endoplasmic reticulum; G, Golgi complex; M, mitochondria; NUC, nucleus; RBC, red blood cell.
FIGURE 4:
FIGURE 4:
Pancreatic α cell hyperplasia and hyperglucagonemia in ERdj4GT/GT mice. (A) Immunofluorescence of insulin (red) and glucagon (green) in pancreatic tissue sections from 16- to 20-wk-old mice. Scale bars, 10 μm. n = 5 mice/genotype. (B) Glucagon protein in pancreatic extracts of 16- to 20-wk-old mice. n = 8 mice/genotype. (C) Plasma glucagon levels in fasted 8- to 16-wk-old mice. n = 11–12 mice/genotype.
FIGURE 5:
FIGURE 5:
ERdj4 deficiency impairs insulin biosynthesis. (A) Immunofluorescence of insulin (red) and BiP (green) in pancreatic tissue sections from 16- to 20-wk-old mice. Scale bars, 5 μm. n = 3 mice/genotype. (B) Metabolic labeling of islets stimulated with 16.7 mM glucose from 6-wk-old C57BL/6 littermates (n = 3 mice/genotype). Equal numbers of trichloroacetic-precipitable counts per minute were immunoprecipitated with insulin antibody, and the immunoprecipitates were separated by SDS–PAGE. Proinsulin signal was visualized by autoradiography and quantitated by Multi Gauge software. The gel is a representative image of an experiment performed in triplicate. (C) Plasma proinsulin/insulin ratio in 12-wk-old, fasted mice. n = 8 mice/genotype. (D) Plasma insulin levels before and after glucose administration to fasted 12-wk-old mice. n = 8–9 mice/genotype.
FIGURE 6:
FIGURE 6:
Hypoinsulinemia causes glucose intolerance in ERdj4GT/GT mice. (A) Fasting blood glucose levels in 16- to 20-wk-old mice. n = 12–14 mice/genotype. (B) Blood glucose levels over time after administration of glucose to fasted 12- to 16-wk-old mice. n = 12–14 mice/genotype. (C) Blood glucose levels over time after administration of human insulin to fasted 16- to 20-wk-old mice. n = 5 mice/genotype.

References

    1. Allotey RA, et al. The EIF2AK3 gene region and type I diabetes in subjects from South India. Genes Immun. 2004;5:648–652. - PubMed
    1. Awad W, Estrada I, Shen Y, Hendershot LM. BiP mutants that are unable to interact with endoplasmic reticulum DnaJ proteins provide insights into interdomain interactions in BiP. Proc Natl Acad Sci USA. 2008;105:1164–1169. - PMC - PubMed
    1. Back SH, Kaufman RJ. Endoplasmic reticulum stress and type 2 diabetes. Annu Rev Biochem. 2012;81:767–793. - PMC - PubMed
    1. Bertolotti A, Zhang Y, Hendershot LM, Harding HP, Ron D. Dynamic interaction of BiP and ER stress transducers in the unfolded-protein response. Nat Cell Biol. 2000;2:326–332. - PubMed
    1. Bridges JP, Wert SE, Nogee LM, Weaver TE. Expression of a human surfactant protein C mutation associated with interstitial lung disease disrupts lung development in transgenic mice. J Biol Chem. 2003;278:52739–52746. - PubMed

Publication types

MeSH terms