

Coarse-scale biases for spirals and orientation in human visual cortex
- PMID: 24336733
- PMCID: PMC3858637
- DOI: 10.1523/JNEUROSCI.0889-13.2013
Coarse-scale biases for spirals and orientation in human visual cortex
Abstract
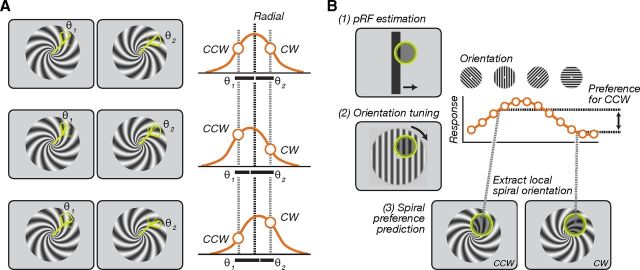
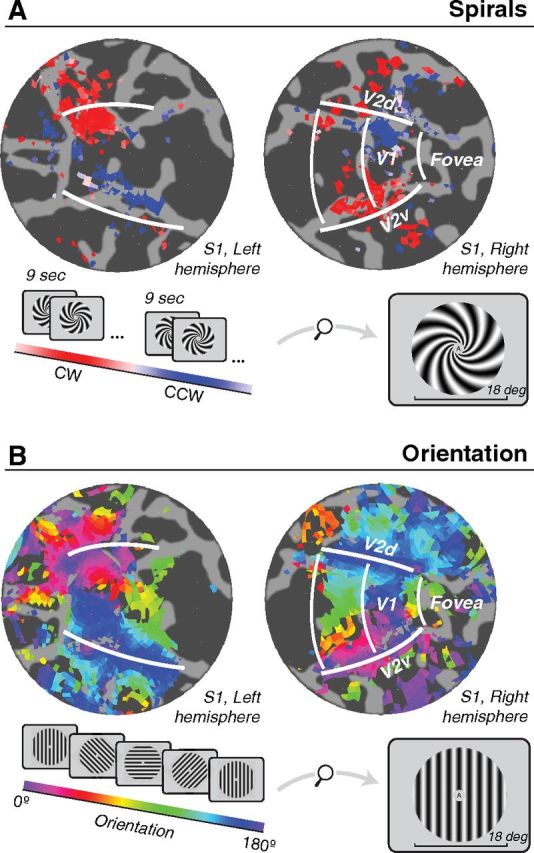
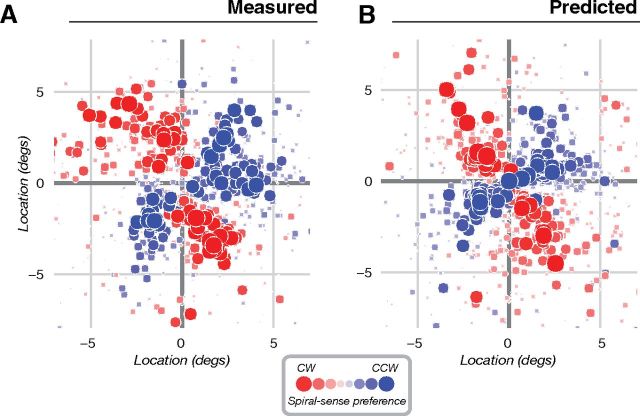
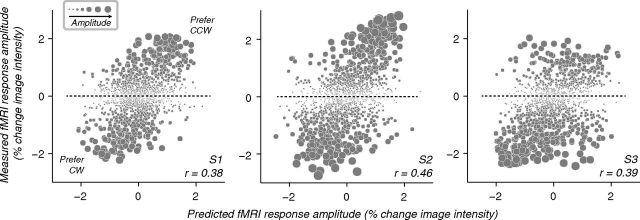
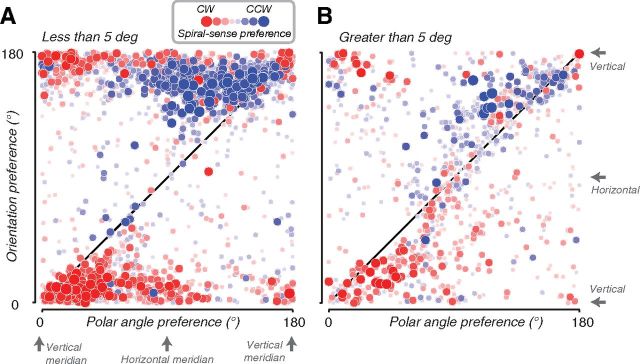
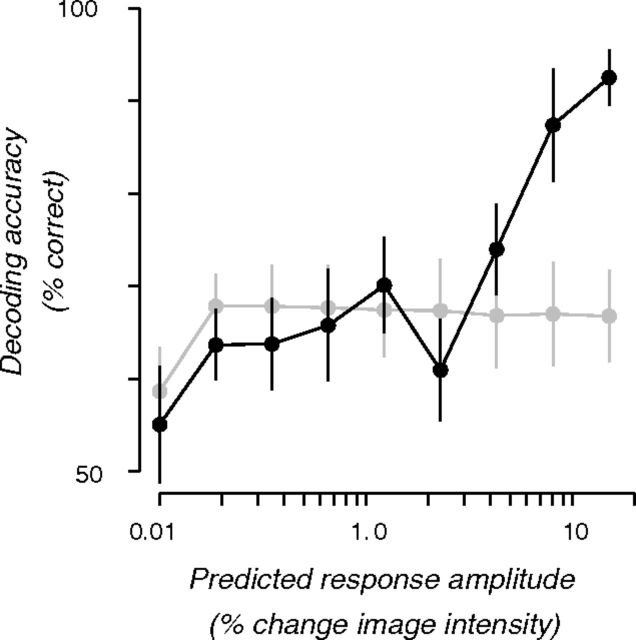
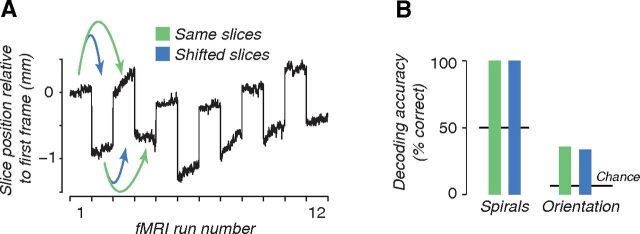
Multivariate decoding analyses are widely applied to functional magnetic resonance imaging (fMRI) data, but there is controversy over their interpretation. Orientation decoding in primary visual cortex (V1) reflects coarse-scale biases, including an over-representation of radial orientations. But fMRI responses to clockwise and counter-clockwise spirals can also be decoded. Because these stimuli are matched for radial orientation, while differing in local orientation, it has been argued that fine-scale columnar selectivity for orientation contributes to orientation decoding. We measured fMRI responses in human V1 to both oriented gratings and spirals. Responses to oriented gratings exhibited a complex topography, including a radial bias that was most pronounced in the peripheral representation, and a near-vertical bias that was most pronounced near the foveal representation. Responses to clockwise and counter-clockwise spirals also exhibited coarse-scale organization, at the scale of entire visual quadrants. The preference of each voxel for clockwise or counter-clockwise spirals was predicted from the preferences of that voxel for orientation and spatial position (i.e., within the retinotopic map). Our results demonstrate a bias for local stimulus orientation that has a coarse spatial scale, is robust across stimulus classes (spirals and gratings), and suffices to explain decoding from fMRI responses in V1.
Figures
Comment in
-
The basis of orientation decoding in human primary visual cortex: fine- or coarse-scale biases?J Neurophysiol. 2015 Jan 1;113(1):1-3. doi: 10.1152/jn.00196.2014. Epub 2014 May 28. J Neurophysiol. 2015. PMID: 24872532
Similar articles
-
Orientation decoding: Sense in spirals?Neuroimage. 2015 Apr 15;110:219-22. doi: 10.1016/j.neuroimage.2014.12.055. Epub 2014 Dec 27. Neuroimage. 2015. PMID: 25550069
-
Spatial scale and distribution of neurovascular signals underlying decoding of orientation and eye of origin from fMRI data.J Neurophysiol. 2017 Feb 1;117(2):818-835. doi: 10.1152/jn.00590.2016. Epub 2016 Nov 30. J Neurophysiol. 2017. PMID: 27903637 Free PMC article.
-
The basis of orientation decoding in human primary visual cortex: fine- or coarse-scale biases?J Neurophysiol. 2015 Jan 1;113(1):1-3. doi: 10.1152/jn.00196.2014. Epub 2014 May 28. J Neurophysiol. 2015. PMID: 24872532
-
Functional analysis of primary visual cortex (V1) in humans.Proc Natl Acad Sci U S A. 1998 Feb 3;95(3):811-7. doi: 10.1073/pnas.95.3.811. Proc Natl Acad Sci U S A. 1998. PMID: 9448245 Free PMC article. Review.
-
Bottom-up and top-down dynamics in visual cortex.Prog Brain Res. 2005;149:65-81. doi: 10.1016/S0079-6123(05)49006-8. Prog Brain Res. 2005. PMID: 16226577 Review.
Cited by
-
Natural scene sampling reveals reliable coarse-scale orientation tuning in human V1.Nat Commun. 2022 Oct 29;13(1):6469. doi: 10.1038/s41467-022-34134-7. Nat Commun. 2022. PMID: 36309512 Free PMC article.
-
fMRI orientation decoding in V1 does not require global maps or globally coherent orientation stimuli.Front Psychol. 2013 Aug 12;4:493. doi: 10.3389/fpsyg.2013.00493. eCollection 2013. Front Psychol. 2013. PMID: 23964251 Free PMC article.
-
Representation of Auditory Motion Directions and Sound Source Locations in the Human Planum Temporale.J Neurosci. 2019 Mar 20;39(12):2208-2220. doi: 10.1523/JNEUROSCI.2289-18.2018. Epub 2019 Jan 16. J Neurosci. 2019. PMID: 30651333 Free PMC article.
-
Is neuroimaging measuring information in the brain?Psychon Bull Rev. 2016 Oct;23(5):1415-1428. doi: 10.3758/s13423-016-1002-0. Psychon Bull Rev. 2016. PMID: 26833316 Free PMC article. Review.
-
Stimulus vignetting and orientation selectivity in human visual cortex.Elife. 2018 Aug 14;7:e37241. doi: 10.7554/eLife.37241. Elife. 2018. PMID: 30106372 Free PMC article.
References
Publication types
MeSH terms
Grants and funding
LinkOut - more resources
Full Text Sources
Other Literature Sources