. 2014 Mar;24(3):401-10.
doi: 10.1101/gr.159608.113. Epub 2013 Dec 11.

Principles of nucleation of H3K27 methylation during embryonic development

Affiliations

Principles of nucleation of H3K27 methylation during embryonic development

Simon J van Heeringen et al. Genome Res. 2014 Mar.

Abstract

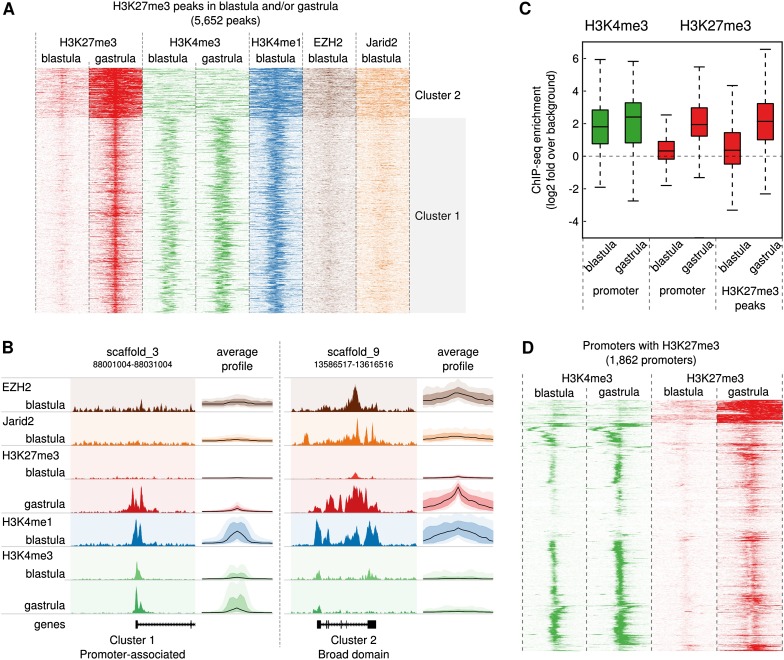
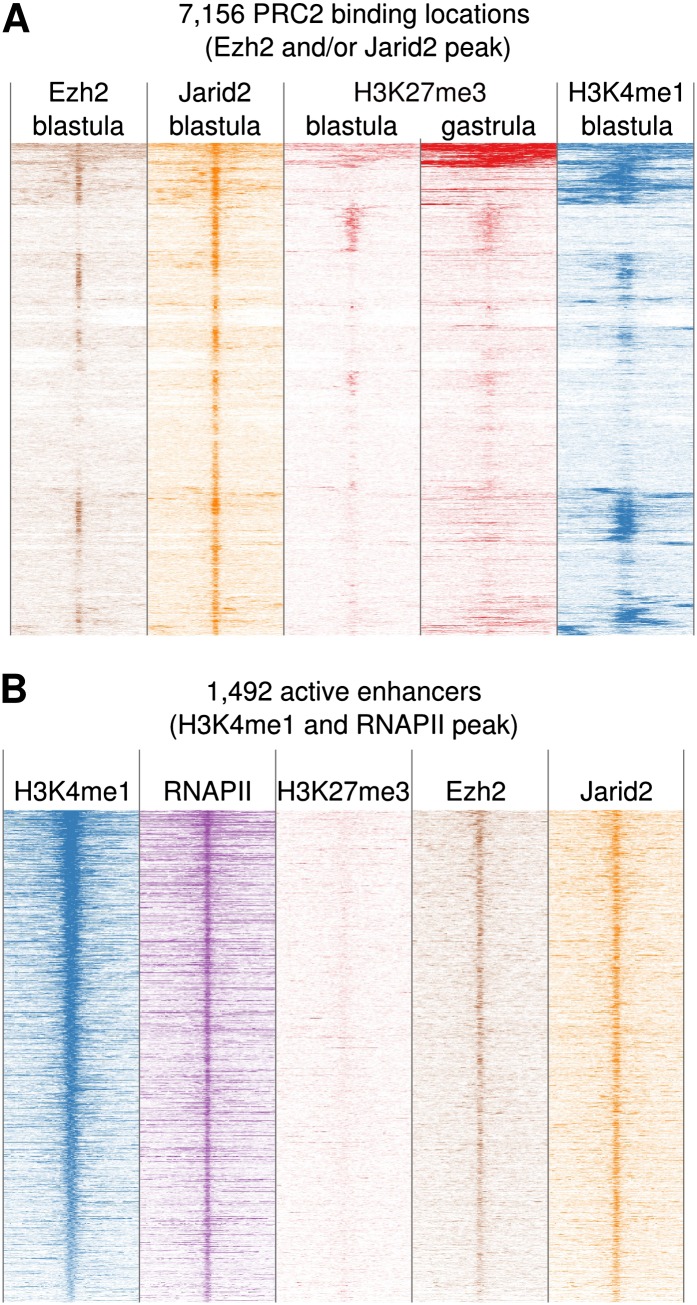
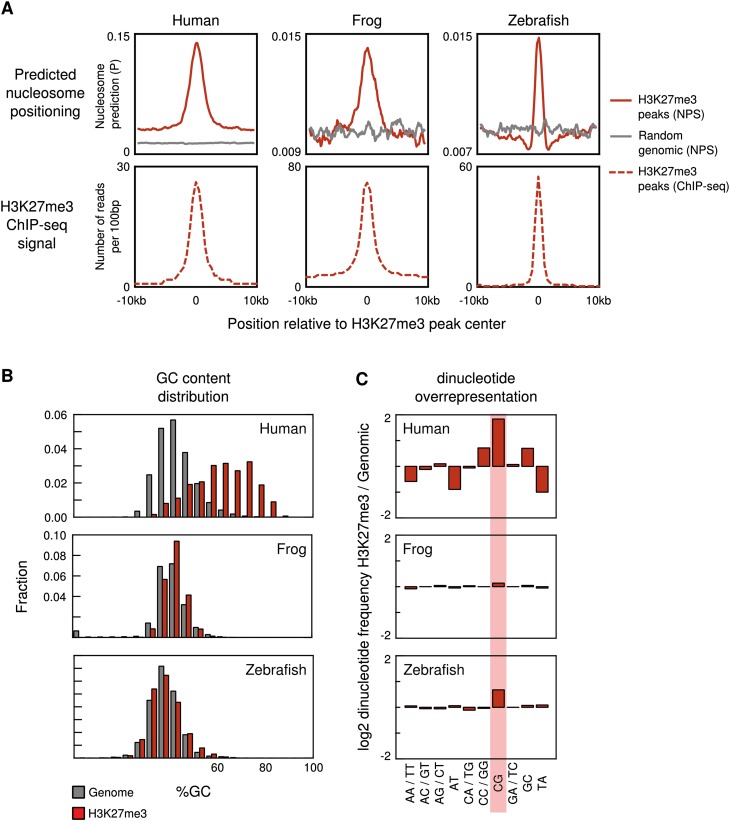
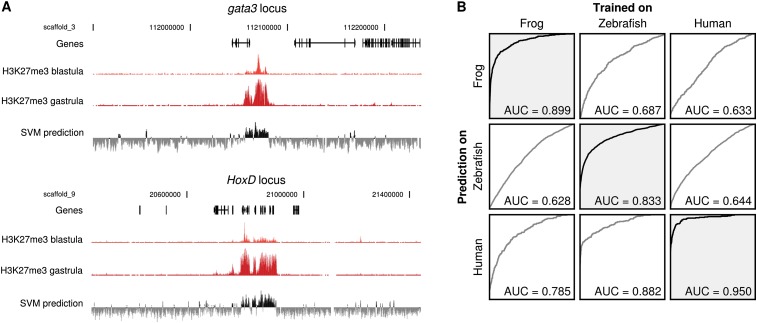
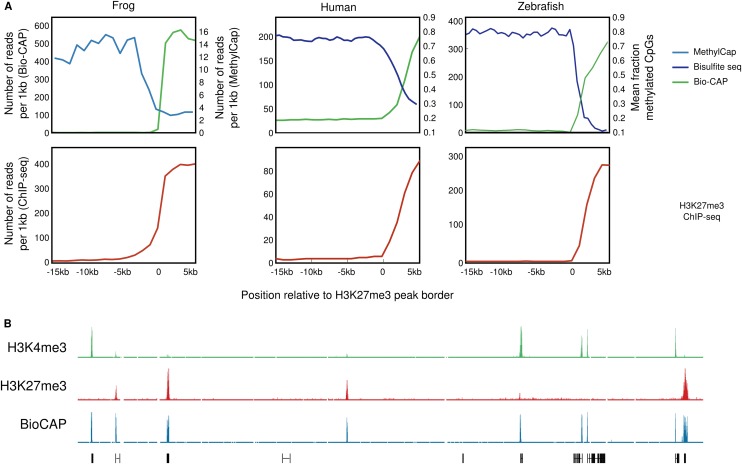
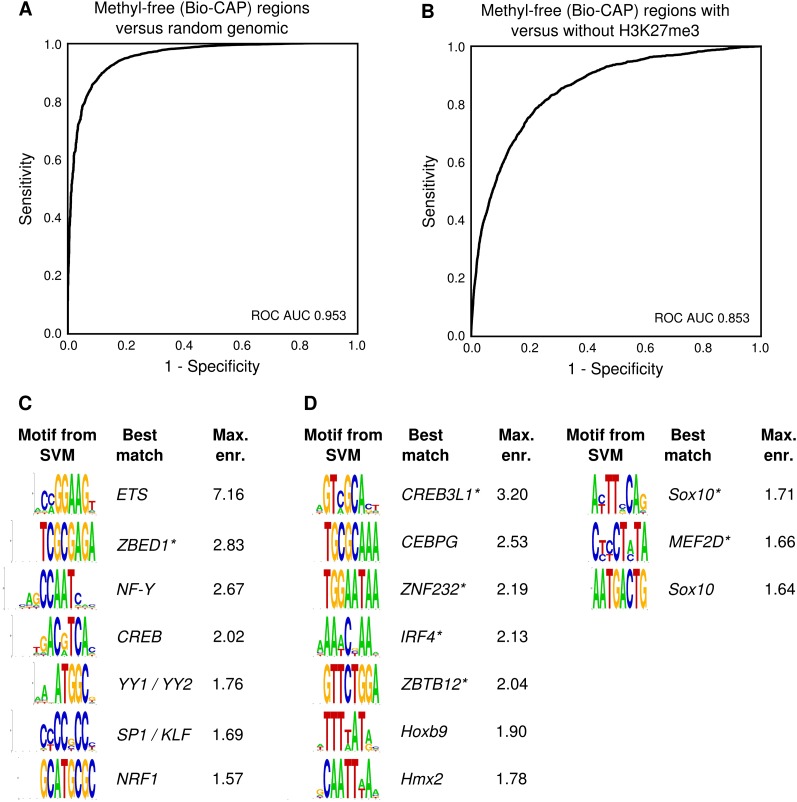
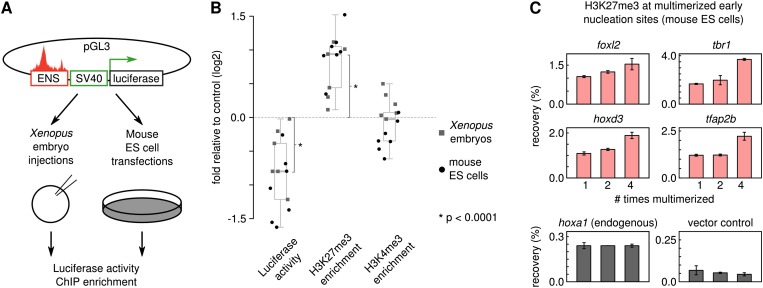
During embryonic development, maintenance of cell identity and lineage commitment requires the Polycomb-group PRC2 complex, which catalyzes histone H3 lysine 27 trimethylation (H3K27me3). However, the developmental origins of this regulation are unknown. Here we show that H3K27me3 enrichment increases from blastula stages onward in embryos of the Western clawed frog (Xenopus tropicalis) within constrained domains strictly defined by sequence. Strikingly, although PRC2 also binds widely to active enhancers, H3K27me3 is only deposited at a small subset of these sites. Using a Support Vector Machine algorithm, these sequences can be predicted accurately on the basis of DNA sequence alone, with a sequence signature conserved between humans, frogs, and fish. These regions correspond to the subset of blastula-stage DNA methylation-free domains that are depleted for activating promoter motifs, and enriched for motifs of developmental factors. These results imply a genetic-default model in which a preexisting absence of DNA methylation is the major determinant of H3K27 methylation when not opposed by transcriptional activation. The sequence and motif signatures reveal the hierarchical and genetically inheritable features of epigenetic cross-talk that impose constraints on Polycomb regulation and guide H3K27 methylation during the exit of pluripotency.


Figures

Figure 1.
Figure 1.
H3K27me3 is newly deposited from blastula stages onward. (A) Heatmap of a k-means clustering analysis (k = 3, Euclidian distance) of H3K27me3 (blastula and gastrula), H3K4me3 (blastula and gastrula), H3K4me1, Ezh2, and Jarid2 (blastula) in 10-kb regions around H3K27me3 peak summits. The rows correspond to the peaks, the x-axis shows the position relative to the peak center. The intensity of the color represents the number of reads in 100-bp windows. The first two clusters are shown: for cluster 3, see Supplemental Figure 1. (B) Average profile and representative example of the two clusters shown in A. The average profiles show the median enrichment (black line) and the 50th and 90th percentiles in a darker and lighter color, respectively. (C) Boxplot showing enrichment of H3K4me3 (green, left) and H3K27me3 (red, right) in 2-kb regions around the TSS for genes marked by H3K27me3 in the blastula or gastrula stage (“promoter”), and all peaks for H3K27me3 in any stage (“H3K27me3 peaks”). The y-axis represents log2 of the fold enrichment compared with randomly selected genomic sequences. The background level (no enrichment; log2 of 0) is marked by a dotted line. (D) H3K4me3 (green) and H3K27me3 (red) enrichment in blastula- and gastrula-stage embryos around transcription start site (TSS; ±5 kb) marked by H3K27me3 in the gastrula. Regions were clustered using hierarchical clustering with the Euclidian distance metric.
Figure 2.
Figure 2.
PRC2 is recruited to the majority of active developmental enhancers. (A) The majority of PRC2 binding sites do not gain H3K27me3. Heatmap of a hierarchical clustering of Ezh2, Jarid2, H3K27me3, and H3K4me1 enrichment around the summits of Ezh2 and Jarid2 peaks. Data are visualized in 100-bp bins in 10-kb regions. (B) PRC2 is recruited to active enhancers. Enrichment of H3K4me1, RNAPII, H3K27me3, Ezh2, and Jarid2 at active enhancers. Data are visualized in 100-bp bins in 10-kb regions and are sorted by H3K4me1. Enhancers are defined as RNAPII peaks in regions with H3K4me1 but not H3K4me3.
Figure 3.
Figure 3.
Conserved and diverged sequence features of vertebrate H3K27me3 domains. (A) The top panel shows the predicted nucleosome occupancy of H3K27me3 domains (red line) and random genomic regions (gray line). The maximum nucleosome occupancy (van der Heijden et al. 2012) was calculated per 1 kb using a moving window (window size, 1 kb; step size, 100 bp). Shown is the mean of predicted maximum occupancy for all H27me3 domains or random genomic regions. The bottom panel shows the median ChIP-seq enrichment of H3K27me3 domains. (B) %GC of H3K27me3 domains and genomic background in human, Xenopus tropicalis, and zebrafish. (C) Overrepresentation of dinucleotides in human, X. tropicalis, and zebrafish H3K27me3 domains compared with the genomic background (log2 of the fold difference in dinucleotide frequency).
Figure 4.
Figure 4.
A k-mer Support Vector Machine (SVM) can accurately predict H3K27me3 domains from the primary sequence in vertebrates. (A) Examples of H3K27me3 domain prediction by a k-mer SVM using k = 8 (lower track; black is a positive score, gray a negative score). H3K27me3 enrichment in the blastula and gastrula is visualized in the top two tracks. (B) Interspecies performance of k-mer SVMs (k = 8) trained on different vertebrates. Performance is visualized in a receiver operator curve (ROC) and the ROC area under curve (ROC AUC) is shown as a performance measure. The y-axis shows the sensitivity; the x-axis, 1 − specificity. The columns indicate the species used for training; the rows indicate the species used for evaluation. For instance, the lower left ROC curve indicates the performance of human sequence classification of an SVM trained on frog.
Figure 5.
Figure 5.
H3K27 methylation in DNA methylation-free regions. (A) The methylation state (top panel) and H3K27me3 enrichment (bottom panel) visualized over H3K27me3 domain borders. The methylation state assessed by MethylCap (X. tropicalis; light blue) or bisulfite sequencing (human and zebrafish; dark blue) is shown, as well as the Bio-CAP signal (green). For H3K27me3 ChIP-seq, MethylCap, and Bio-CAP, the number of reads per 1 kb is shown from −15 kb to +5 kb relative to the H3K27me3 domain border. The bisulfite seq signal indicates the mean fraction of methylated CpGs. For data sets, see Supplemental Table 6. (B) Screenshot of a representative profile of H3K4me3 (green), H3K27me3 (red), and Bio-CAP (blue) ChIP-seq enrichment in X. tropicalis blastula-stage embryos.
Figure 6.
Figure 6.
Transcription factor motifs predict the H3K27me3 state of DNA methylation-free regions. (A) ROC curve of the classification of X. tropicalis DNA methylation-free regions (Bio-CAP peaks) compared with random genomic regions using a k-mer SVM (k = 8). (B) ROC curve of the classification of DNA methylation-free regions (Bio-CAP peaks) using a k-mer SVM (k = 8). The regions are classified as either gaining H3K27me3 or remaining devoid of H3K27me3. (C) Motifs from k-mers with a high SVM weight, which are enriched in (active) DNA methylation-free regions without H3K27me3. The best match to known motifs is shown; uncertain matches are marked with an asterisk. (D) Motifs from k-mers with a low SVM weight that are enriched in (repressed) DNA methylation-free regions with H3K27me3.
Figure 7.
Figure 7.
Early H3K27me3 nucleation sites encode conserved repressive capacity. (A) Repression assay of H3K27me3 early nucleation sites in Xenopus embryos and mouse ES cells. (B) Early nucleation sites function as repressive elements. Shown is luciferase activity normalized to Renilla as fold change relative to control, H3K27me3 ChIP-qPCR enrichment relative to control, and H3K4me3 ChIP-qPCR enrichment relative to control (log2 scale; significance, Wilcoxon signed rank test; Xenopus, light square dots; ES cells, dark round dots). (C) H3K27me3 enrichment increases with length of susceptible sequence. Shown is the H3K27me3 ChIP-qPCR recovery for four SVM-positive H3K27me3 nucleation sites, an endogenous locus (hoxa1), and a vector backbone control.

Similar articles

Cited by

References

    1. Akkers RC, van Heeringen SJ, Jacobi UG, Janssen-Megens EM, Françoijs K-J, Stunnenberg HG, Veenstra GJC 2009. A hierarchy of H3K4me3 and H3K27me3 acquisition in spatial gene regulation in Xenopus embryos. Dev Cell 17: 425–434 - PMC - PubMed
    1. Akkers RC, Jacobi UG, Veenstra GJC 2012. Chromatin immunoprecipitation analysis of Xenopus embryos. Methods Mol Biol 917: 279–292 - PubMed
    1. Arnold P, Schöler A, Pachkov M, Balwierz PJ, Jørgensen H, Stadler MB, van Nimwegen E, Schübeler D 2013. Modeling of epigenome dynamics identifies transcription factors that mediate Polycomb targeting. Genome Res 23: 60–73 - PMC - PubMed
    1. Atchison L, Ghias A, Wilkinson F, Bonini N, Atchison ML 2003. Transcription factor YY1 functions as a PcG protein in vivo. EMBO J 22: 1347–1358 - PMC - PubMed
    1. Bartke T, Vermeulen M, Xhemalce B, Robson SC, Mann M, Kouzarides T 2010. Nucleosome-interacting proteins regulated by DNA and histone methylation. Cell 143: 470–484 - PMC - PubMed

Publication types

Associated data