

A sustained increase in plasma NEFA upregulates the Toll-like receptor network in human muscle
- PMID: 24337154
- PMCID: PMC3945433
- DOI: 10.1007/s00125-013-3111-x
A sustained increase in plasma NEFA upregulates the Toll-like receptor network in human muscle
Abstract
Aims/hypothesis: Insulin-sensitive tissues (muscle, liver) of individuals with obesity and type 2 diabetes mellitus are in a state of low-grade inflammation, characterised by increased Toll-like receptor (TLR) expression and TLR-driven signalling. However, the cause of this mild inflammatory state is unclear. We tested the hypothesis that a prolonged mild increase in plasma NEFA will increase TLR expression and TLR-driven signalling (nuclear factor κB [NFκB] and mitogen-activated kinase [MAPK]) and impair insulin action in muscle of lean healthy individuals.
Methods: Twelve lean, normal-glucose-tolerant participants were randomised to receive a 48 h infusion (30 ml/h) of saline or Intralipid followed by a euglycaemic-hyperinsulinaemic clamp. Vastus lateralis muscle biopsies were performed before and during the clamp.
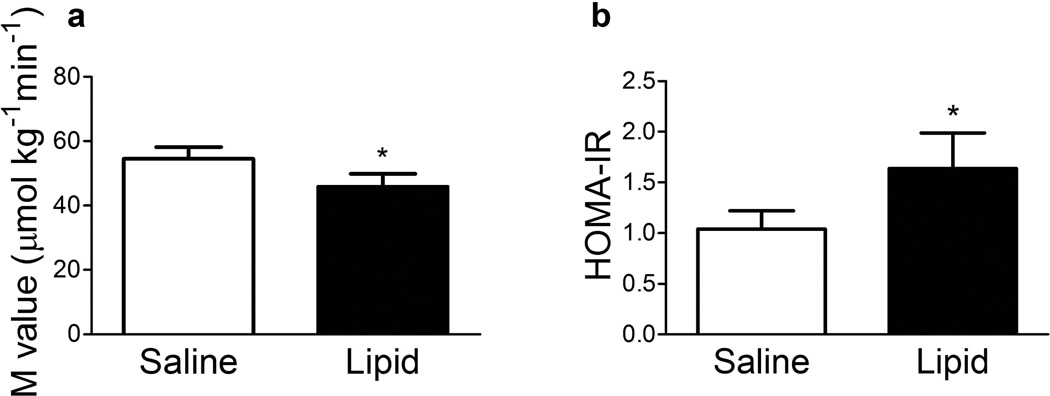
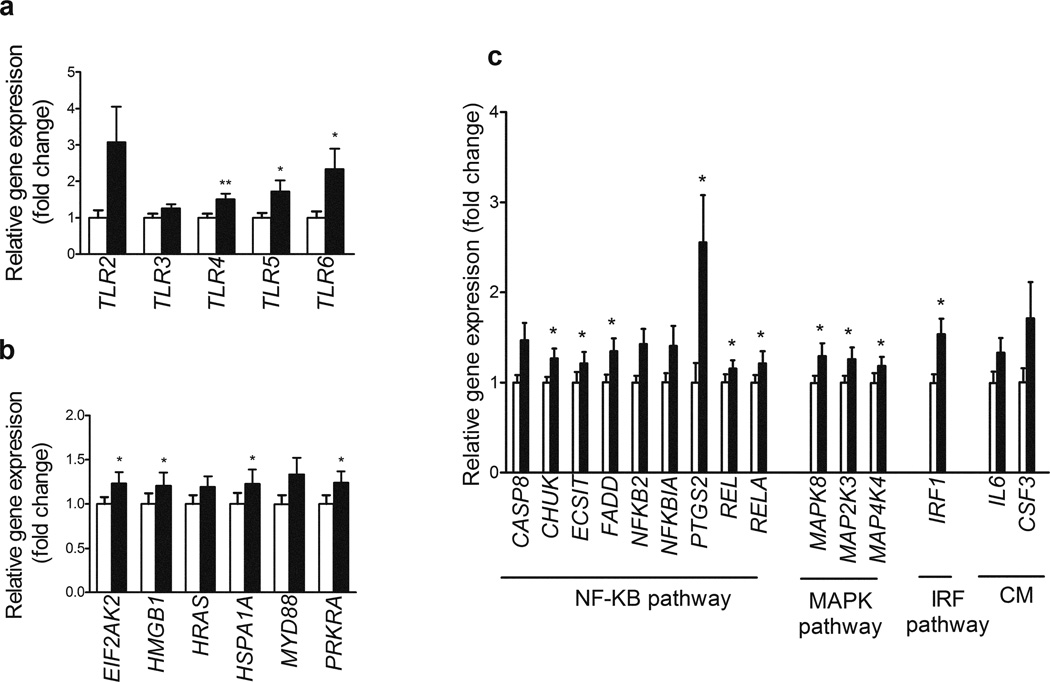
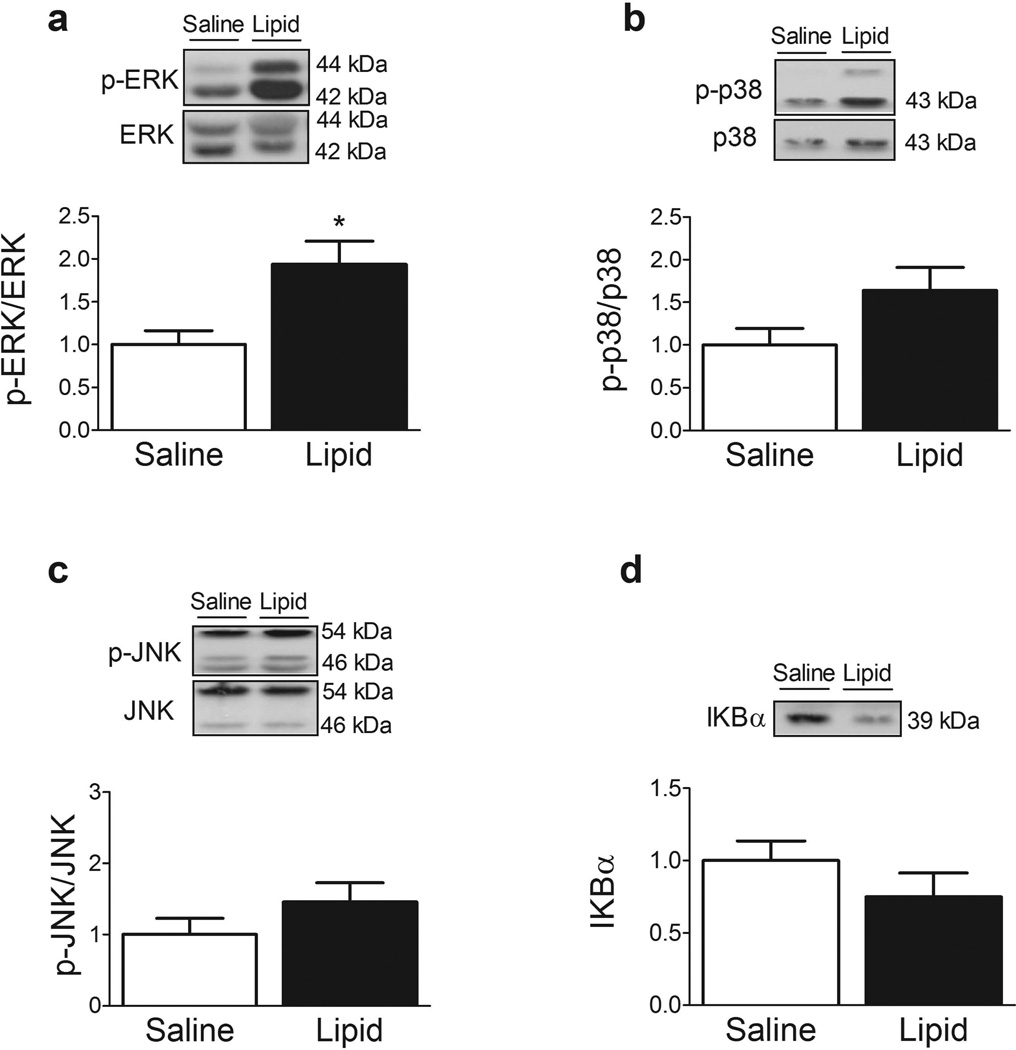
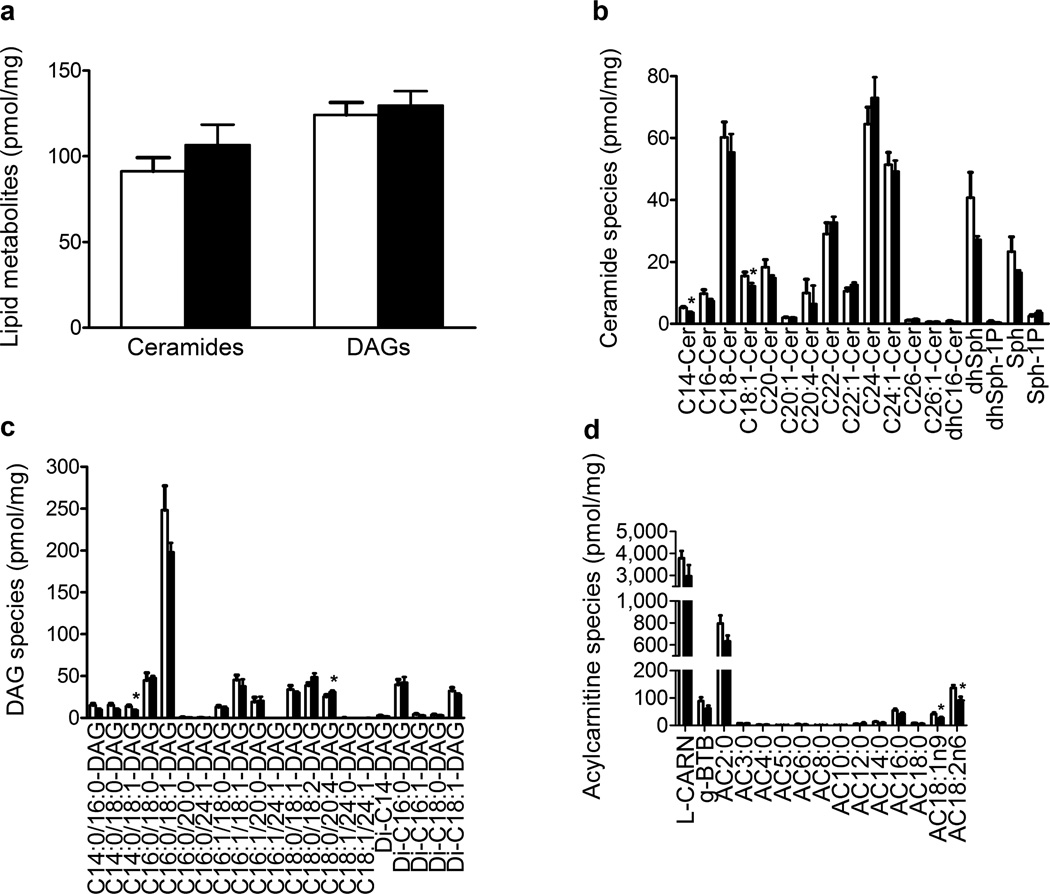
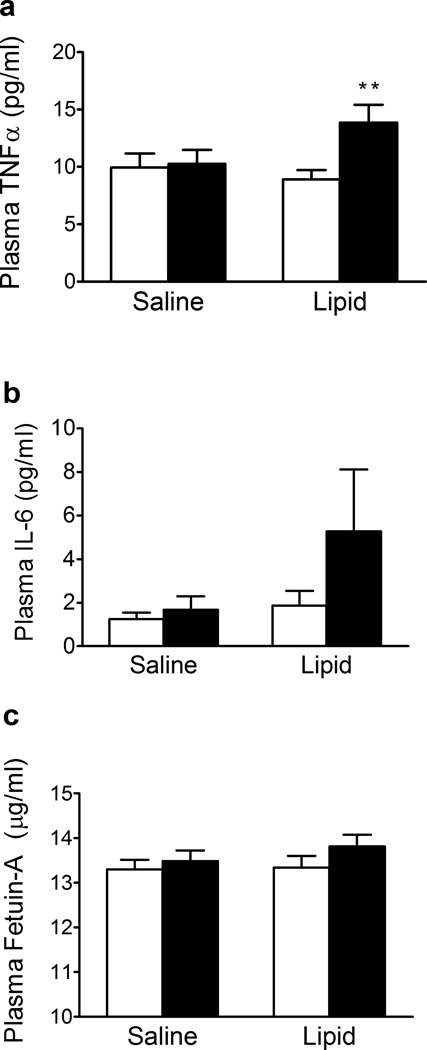
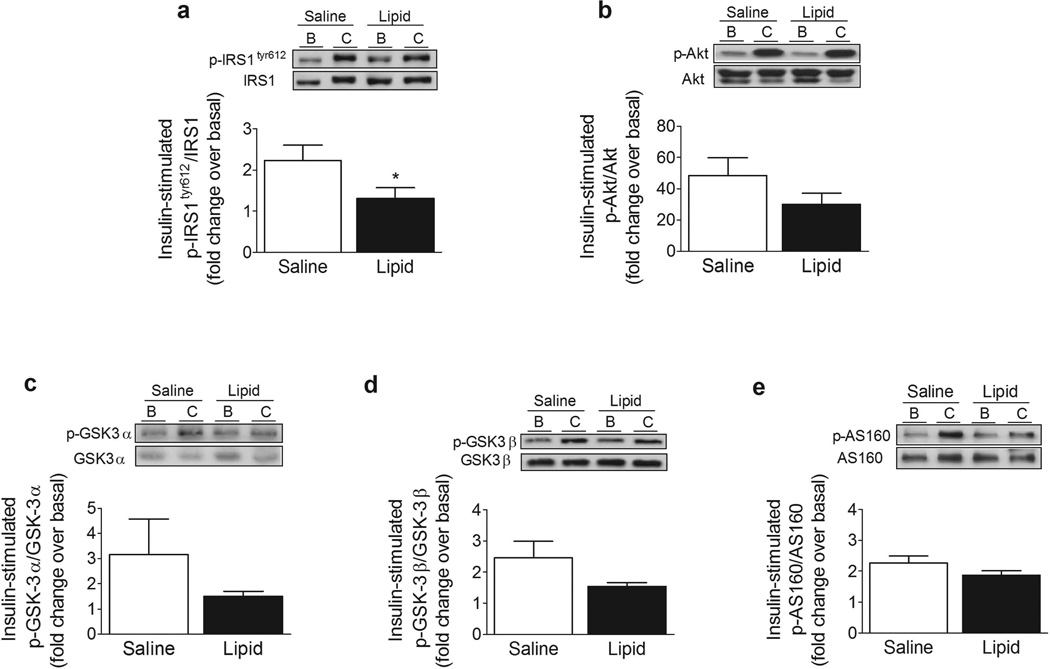
Results: Lipid infusion impaired insulin-stimulated IRS-1 tyrosine phosphorylation and reduced peripheral insulin sensitivity (p < 0.01). The elevation in circulating NEFA increased expression of TLR3, TLR4 and TLR5, and several MAPK (MAPK8, MAP4K4, MAP2K3) and inhibitor of κB kinase-NFκB (CHUK [IKKA], c-REL [REL] and p65 [RELA, NFKB3, p65]) signalling genes (p < 0.05). The lipid infusion also increased extracellular signal-regulated kinase (ERK) phosphorylation (p < 0.05) and tended to reduce the content of inhibitor of kappa Bα (p = 0.09). The muscle content of most diacylglycerol, ceramide and acylcarnitine species was unaffected. In summary, insulin resistance induced by prolonged low-dose lipid infusion occurs together with increased TLR-driven inflammatory signalling and impaired insulin-stimulated IRS-1 tyrosine phosphorylation.
Conclusions/interpretation: A sustained, mild elevation in plasma NEFA is sufficient to increase TLR expression and TLR-driven signalling (NFκB and MAPK) in lean individuals. The activation of this pathway by NEFA may be involved in the pathogenesis of insulin resistance in humans.
Trial registration: ClinicalTrials.gov NCT01740817.
Figures
Similar articles
-
Fatty acids acutely enhance insulin-induced oxidative stress and cause insulin resistance by increasing mitochondrial reactive oxygen species (ROS) generation and nuclear factor-κB inhibitor (IκB)-nuclear factor-κB (NFκB) activation in rat muscle, in the absence of mitochondrial dysfunction.Diabetologia. 2012 Mar;55(3):773-82. doi: 10.1007/s00125-011-2396-x. Epub 2011 Dec 13. Diabetologia. 2012. PMID: 22159911
-
Fatty acid-induced insulin resistance: decreased muscle PI3K activation but unchanged Akt phosphorylation.J Clin Endocrinol Metab. 2002 Jan;87(1):226-34. doi: 10.1210/jcem.87.1.8187. J Clin Endocrinol Metab. 2002. PMID: 11788651
-
Elevated toll-like receptor 4 expression and signaling in muscle from insulin-resistant subjects.Diabetes. 2008 Oct;57(10):2595-602. doi: 10.2337/db08-0038. Epub 2008 Jul 15. Diabetes. 2008. PMID: 18633101 Free PMC article.
-
A low dose lipid infusion is sufficient to induce insulin resistance and a pro-inflammatory response in human subjects.PLoS One. 2018 Apr 12;13(4):e0195810. doi: 10.1371/journal.pone.0195810. eCollection 2018. PLoS One. 2018. PMID: 29649324 Free PMC article.
-
Dissociation between fat-induced in vivo insulin resistance and proximal insulin signaling in skeletal muscle in men at risk for type 2 diabetes.J Clin Endocrinol Metab. 2004 Mar;89(3):1301-11. doi: 10.1210/jc.2003-031243. J Clin Endocrinol Metab. 2004. PMID: 15001626 Clinical Trial.
Cited by
-
Stress and inflammatory gene networks in bovine liver are altered by plane of dietary energy during late pregnancy.Funct Integr Genomics. 2015 Sep;15(5):563-76. doi: 10.1007/s10142-015-0443-2. Epub 2015 May 5. Funct Integr Genomics. 2015. PMID: 25939883
-
Silica nanoparticles trigger hepatic lipid-metabolism disorder in vivo and in vitro.Int J Nanomedicine. 2018 Nov 9;13:7303-7318. doi: 10.2147/IJN.S185348. eCollection 2018. Int J Nanomedicine. 2018. PMID: 30519016 Free PMC article.
-
Effect of Low-Fat Diet in Obese Mice Lacking Toll-like Receptors.Nutrients. 2018 Oct 9;10(10):1464. doi: 10.3390/nu10101464. Nutrients. 2018. PMID: 30304787 Free PMC article.
-
Tankyrase inhibition ameliorates lipid disorder via suppression of PGC-1α PARylation in db/db mice.Int J Obes (Lond). 2020 Aug;44(8):1691-1702. doi: 10.1038/s41366-020-0573-z. Epub 2020 Apr 21. Int J Obes (Lond). 2020. PMID: 32317752 Free PMC article.
-
Fetuin-A: a novel link between obesity and related complications.Int J Obes (Lond). 2015 May;39(5):734-41. doi: 10.1038/ijo.2014.203. Epub 2014 Dec 3. Int J Obes (Lond). 2015. PMID: 25468829 Review.
References
-
- Miles JM, Wooldridge D, Grellner WJ, et al. Nocturnal and postprandial free fatty acid kinetics in normal and type 2 diabetic subjects: effects of insulin sensitization therapy. Diabetes. 2003;52:675–681. - PubMed
-
- Bajaj M, Suraamornkul S, Kashyap S, Cusi K, Mandarino L, DeFronzo RA. Sustained reduction in plasma free fatty acid concentration improves insulin action without altering plasma adipocytokine levels in subjects with strong family history of type 2 diabetes. J Clin Endocrinol Metab. 2004;89:4649–4655. - PubMed
-
- Boden G, Chen X, Rosner J, Barton M. Effects of a 48-h fat infusion on insulin secretion and glucose utilization. Diabetes. 1995;44:1239–1242. - PubMed
-
- Itani SI, Ruderman NB, Schmieder F, Boden G. Lipid-induced insulin resistance in human muscle is associated with changes in diacylglycerol, protein kinase C, IkappaB-alpha. Diabetes. 2002;51:2005–2011. - PubMed
Publication types
MeSH terms
Substances
Associated data
Grants and funding
- F32 DK095565/DK/NIDDK NIH HHS/United States
- R01-DK80157/DK/NIDDK NIH HHS/United States
- TR000149/TR/NCATS NIH HHS/United States
- UL1 TR000149/TR/NCATS NIH HHS/United States
- UL1 TR001120/TR/NCATS NIH HHS/United States
- 1F32DK095565-01A1/DK/NIDDK NIH HHS/United States
- R01-DK089229/DK/NIDDK NIH HHS/United States
- P20 RR017677/RR/NCRR NIH HHS/United States
- KL2 TR001118/TR/NCATS NIH HHS/United States
- P30 CA138313/CA/NCI NIH HHS/United States
- R01 DK089229/DK/NIDDK NIH HHS/United States
- C06 RR018823/RR/NCRR NIH HHS/United States
- R01 DK080157/DK/NIDDK NIH HHS/United States
LinkOut - more resources
Full Text Sources
Other Literature Sources
Medical
Research Materials
Miscellaneous
