. 2014 Mar;53(1):55-63.
doi: 10.1007/s00411-013-0507-4. Epub 2013 Dec 13.

Sex differences in the incidence of chronic myeloid leukemia

Affiliations

Sex differences in the incidence of chronic myeloid leukemia

Tomas Radivoyevitch et al. Radiat Environ Biophys. 2014 Mar.

Abstract

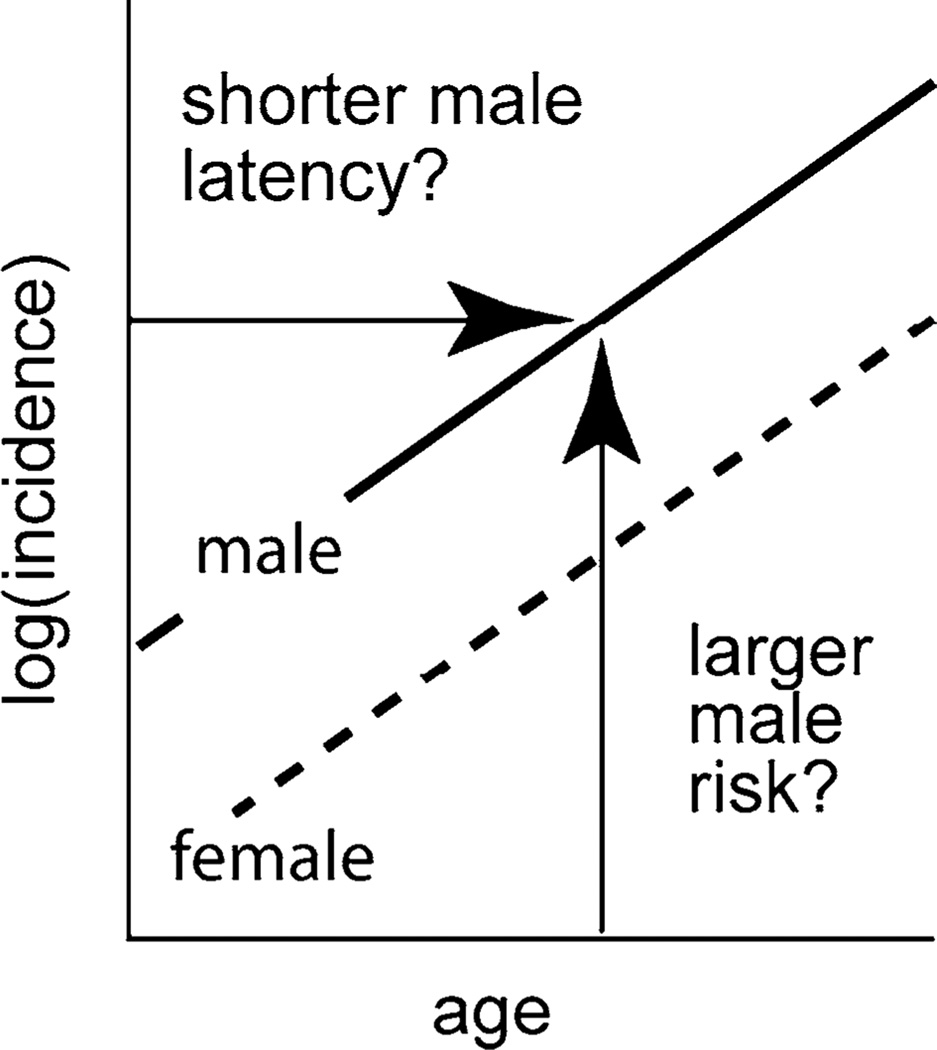
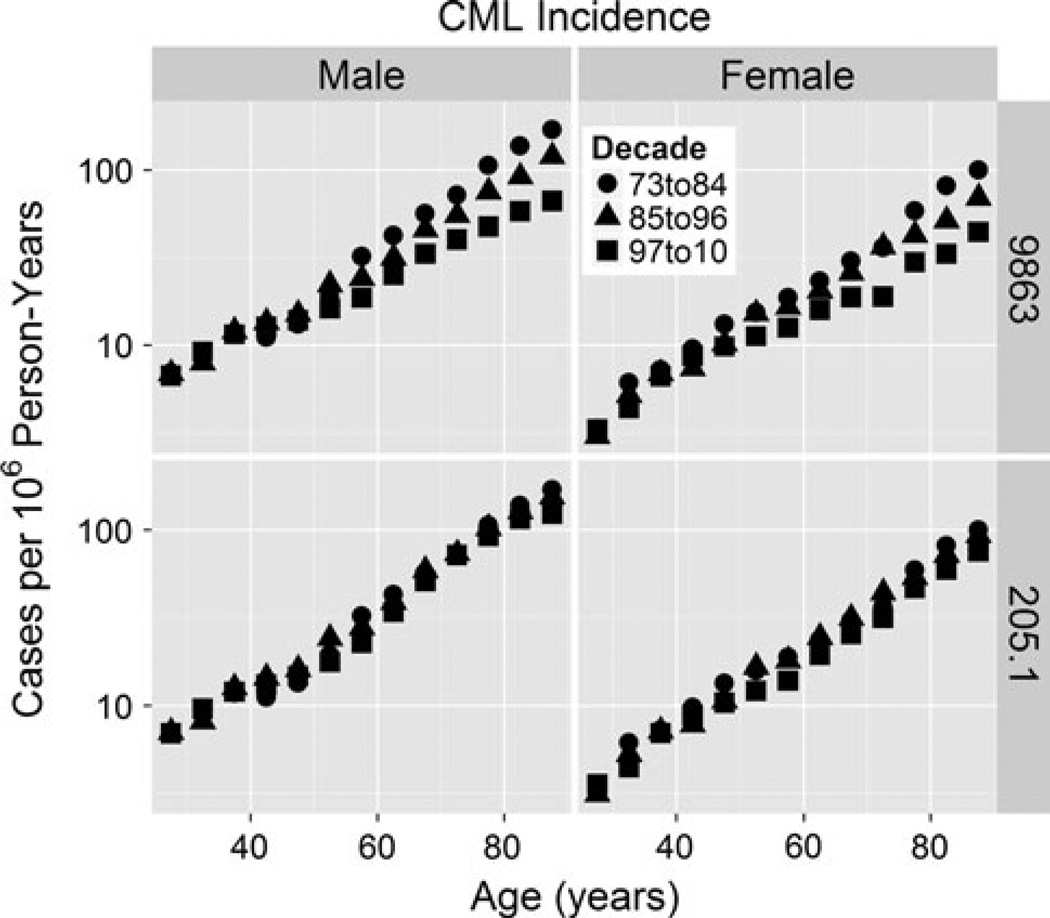
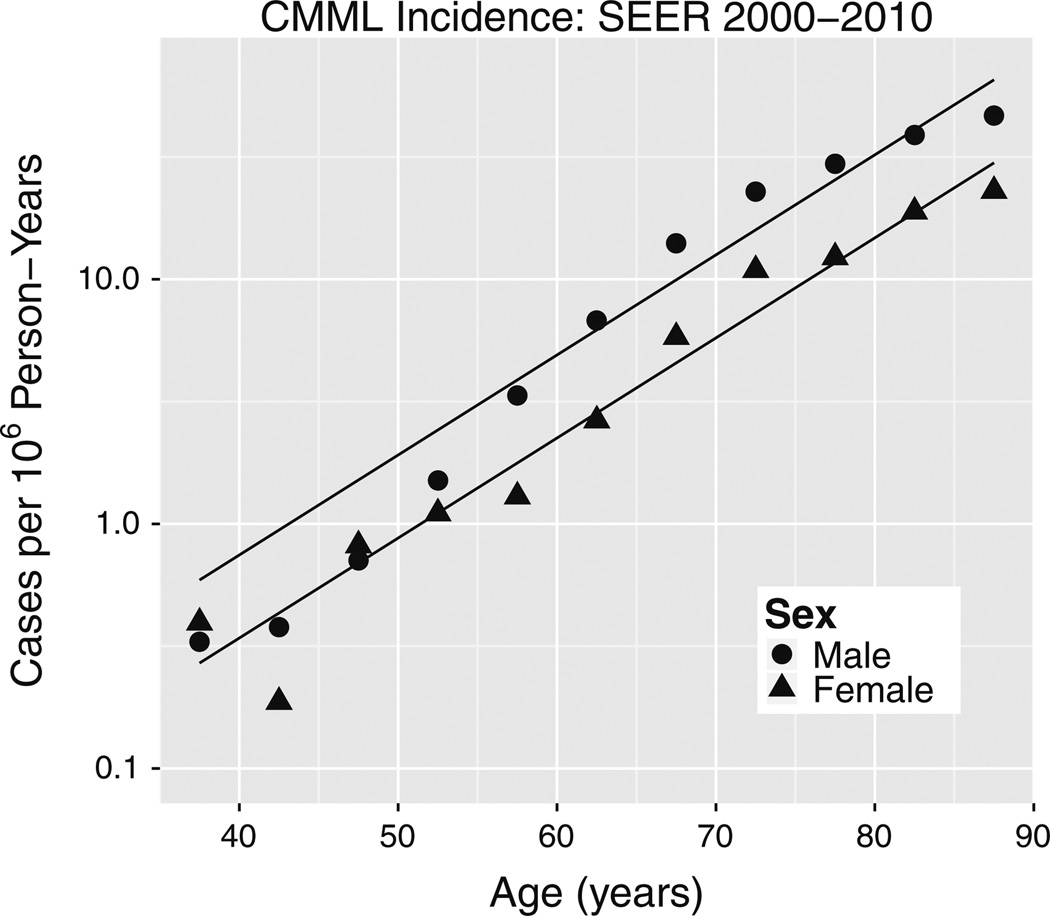
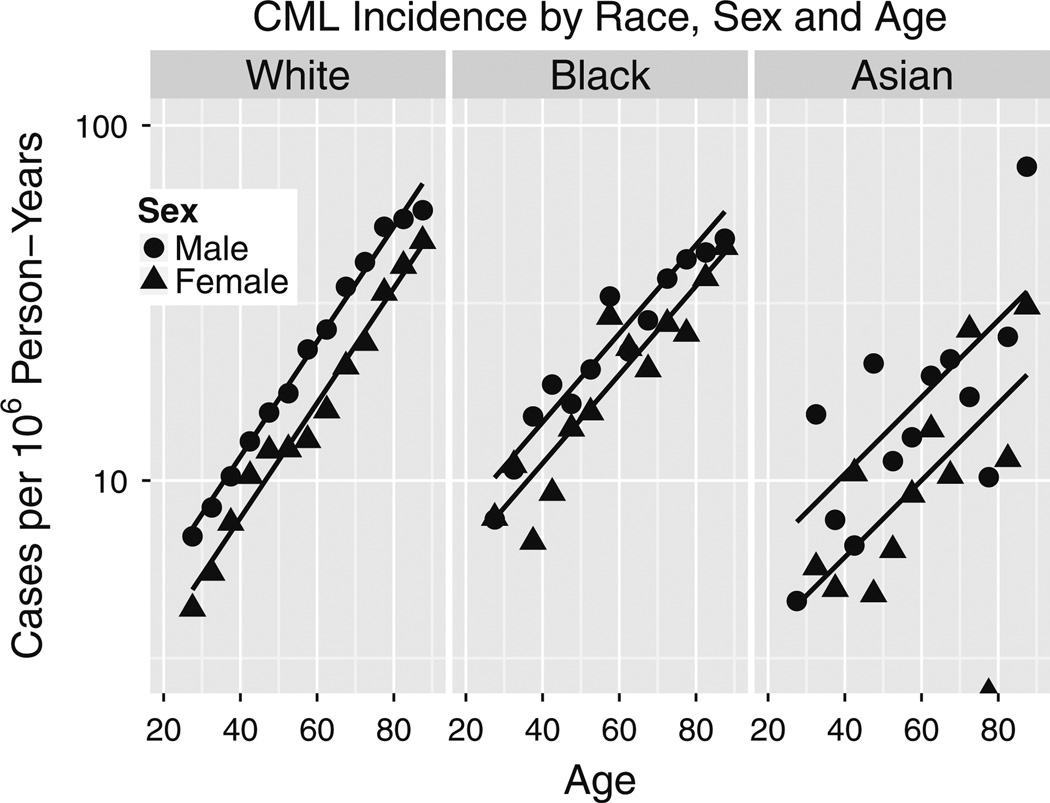
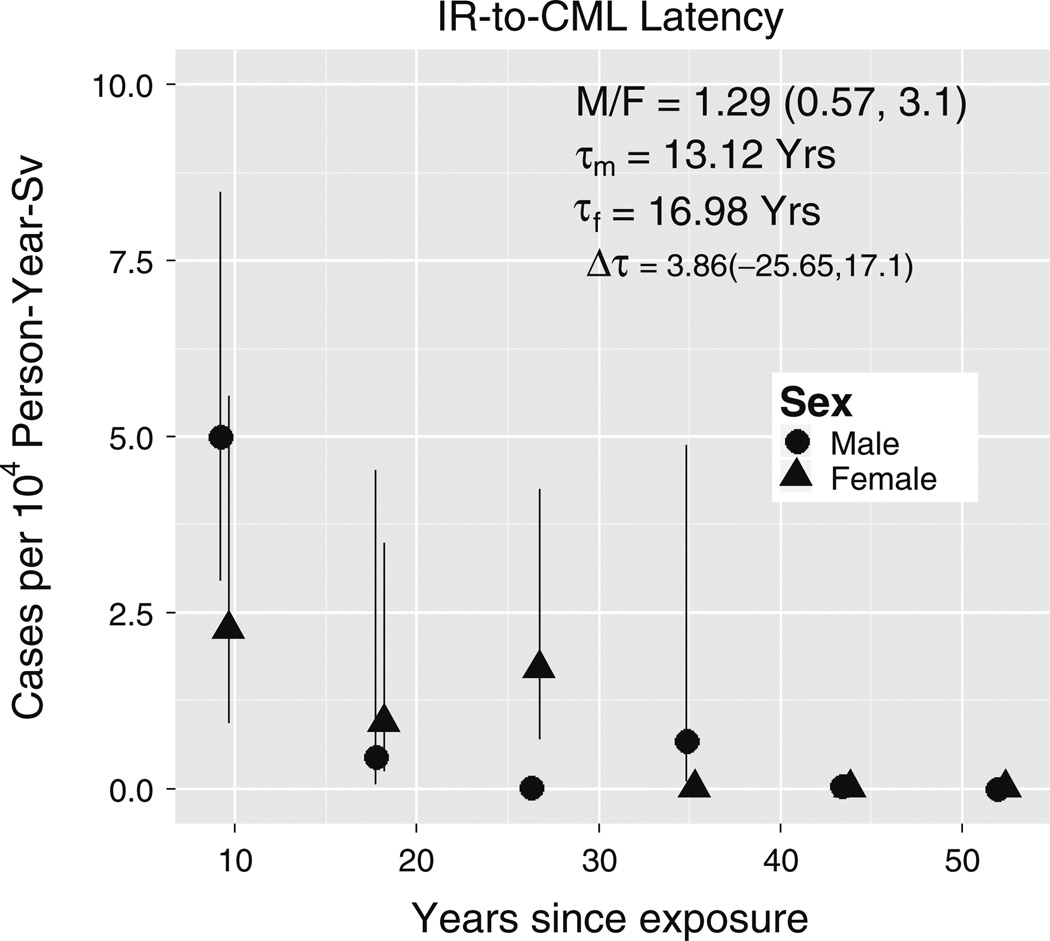
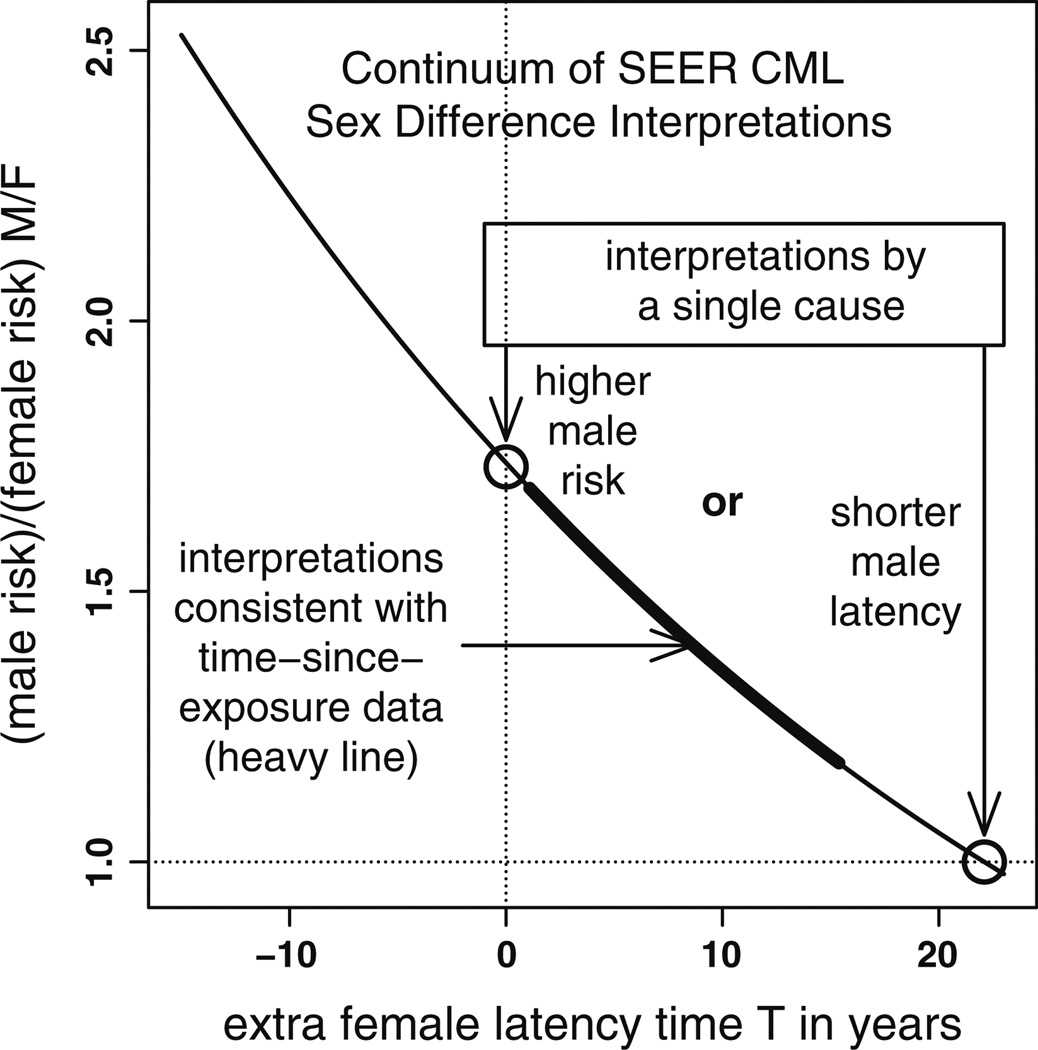
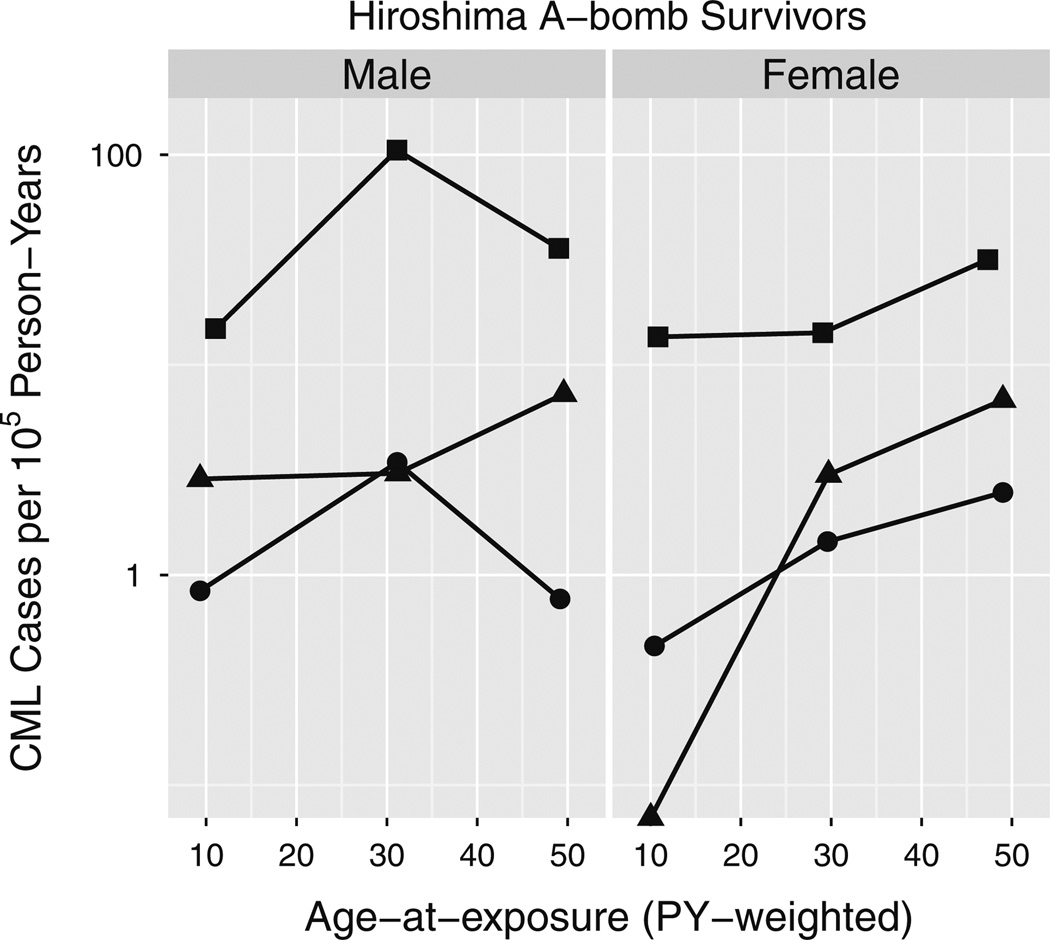
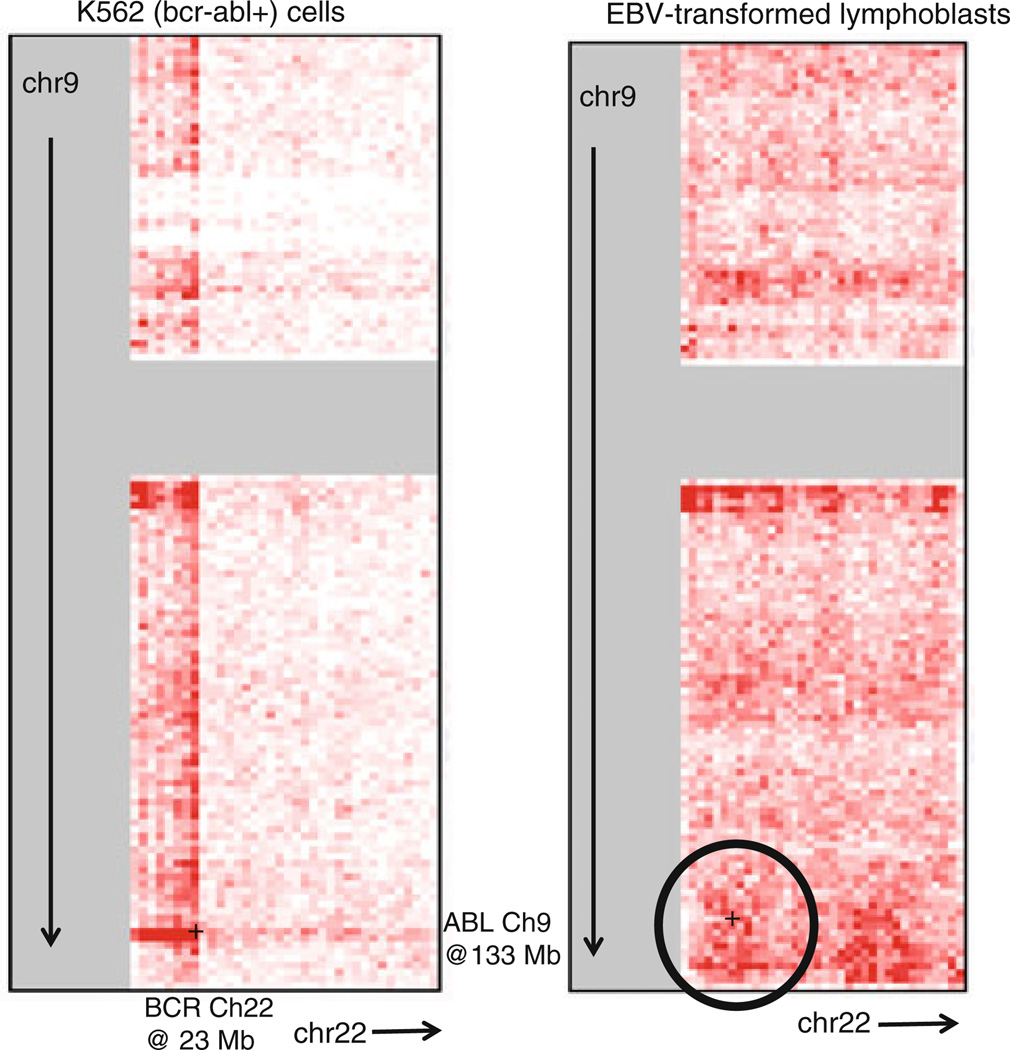
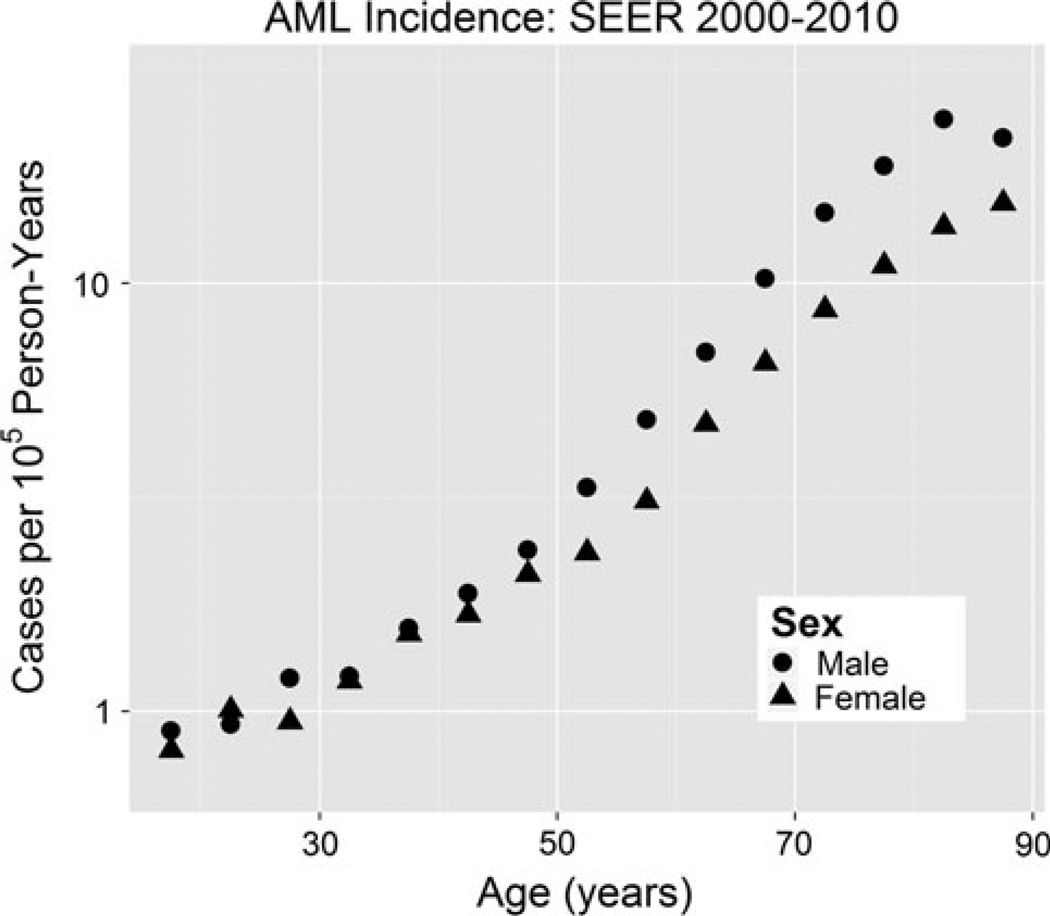
The incidence of chronic myeloid leukemia (CML), which is caused by BCR/ABL chimeric oncogene formation in a pluripotent hematopoietic stem cell (HSC), increases with age and exposure to ionizing radiation. CML is a comparatively well-characterized neoplasm, important for its own sake and useful for insights into other neoplasms. Here, Surveillance, Epidemiology and End Results (SEER) CML data are analyzed after considering possible misclassification of chronic myelo-monocytic leukemia as CML. For people older than 25 years, plots of male and female CML log incidences versus age at diagnosis are approximately parallel straight lines with males either above or to the left of females. This is consistent with males having a higher risk of developing CML or a shorter latency from initiation to diagnosis of CML. These distinct mechanisms cannot be distinguished using SEER data alone. Therefore, CML risks among male and female Japanese A-bomb survivors are also analyzed. The present analyses suggest that sex differences in CML incidence more likely result from differences in risk than in latency. The simplest but not the sole interpretation of this is that males have more target cells at risk to develop CML. Comprehensive mathematical models of CML could lead to a better understanding of the role of HSCs in CML and other preleukemias that can progress to acute leukemia.


Conflict of interest statement

Conflict of interest RPG is a part-time employee of Celgene Corp.

Figures

Fig. 1
Fig. 1
If CML log incidences for males and females are linear and parallel, a continuum of interpretations exists that includes: (1) males having shorter latencies between initiation and clinical CML than females but the same risks (i.e., males left of females) and (2) males having higher risks than females but no difference in latency (i.e., males above females)
Fig. 2
Fig. 2
ICD-O2 code 9863 (CML) versus ICD9 code 205.1 (CML + CMML) in the SEER data set
Fig. 3
Fig. 3
Incidence of CMML (ICD-O3 9945) in SEER 2000–2010 data. The fit of Eq. (1a) to this data (albeit a visibly poor fit) yielded a pooled-sex aging rate constant k = 0.094 per year that is significantly greater than k = 0.037 per year for CML in whites in Fig. 4 wherein male and female k estimates were pooled based on Table 1
Fig. 4
Fig. 4
Adult CML incidence age-responses versus race in SEER 2000–2010. Zero CMLs among 75–80 year old Asian females yielded log(0) = −∞ shown as a point on the x-axis. The units of k are 1/year
Fig. 5
Fig. 5
Using ICD-O2 CML code 9863 and only whites in SEER 9 (1973–2010) and SEER 18 (2000–2010), k estimates (of Eq. 1a) have decreased since 1987
Fig. 6
Fig. 6
CML latency. Data points are fitted Fts of Eq. (3). Male and female radiation-to-CML mean waiting times are τm and τf. M/F is the sum of Fts for males divided by the sum for females. Fts error bars are Wald 95 % CI. To improve visibility, a 1-year shift was added to female x-axis values
Fig. 7
Fig. 7
Interpretations of CML sex differences form a curve through two pure (single cause) forms (o): males with shorter latencies than females but the same risks (x-axis point) and males with higher risks than females but no difference in latency (y-axis point). Thin curve mechanisms indistinguishable by SEER data alone. Thick curve points consistent with fit of Eq. (2) to Japanese A-bomb survivor data
Fig. 8
Fig. 8
CML crude incidence dependence on age at exposure in Hiroshima. Survivors were partitioned into three dose groups, low (D <0.02 Sv; filled circle), medium (0.02 Sv < D < 1 Sv; filled triangle) and high (D > 1 Sv; filled square); and 3 age-at-exposure groups (age < 20, 20 < age < 40 and age > 40). Person-year-weighted averages of age at exposures are plotted on the x-axis and CML cases diagnosed between 1950 and 2001 divided by corresponding person-years are shown on the y-axis. A 0 case point, log(0) = −∞, is shown on the x-axis
Fig. 9
Fig. 9
Non-random closeness of BCR and ABL observed by interphase FISH (Kozubek et al. 1999) has been modeled (solid curve) to infer greater risks of BCR/ABL per target cell than otherwise expected (Radivoyevitch et al. 2001). This figure is a modification of Fig. 3 in Radiat Environ Biophys 40 (1):1–9
Fig. 10
Fig. 10
Hi-C DNASeq coverage at touch points between chromosomes 9 and 22. The CML cell line K562 has a BCR/ABL translocation. The lymphoblast cell line is viewed here as a CML target cell surrogate. Circled is a region with above average DNASeq coverage near ABL on chromosome 9 and BCR on chromosome 22. Each bin/pixel is 1 Mbp ×1 Mbp. The underlying heat map, generated via interactions with http://hic.umassmed.edu/heatmap/heatmap.php, does not preexist on this Web site
Fig. 11
Fig. 11
AML (ICD-9 205.0) incidence versus age in SEER 2000–2010 data. Sex differences in incidence are observed only after ages greater than 50 years old

References

    1. Akaike H. A new look at the statistical model identification. IEEE Trans Autom Control. 1974;19:716–723.
    1. Beheshti A, Sachs RK, Peluso M, Rietman E, Hahnfeldt P, Hlatky L. Age and space irradiation modulate tumor progression: implications for carcinogenesis risk. Radiat Res. 2013;179(2):208–220. - PubMed
    1. Bjorkholm M, Ohm L, Eloranta S, Derolf A, Hultcrantz M, Sjoberg J, Andersson T, Hoglund M, Richter J, Landgren O, Kristinsson SY, Dickman PW. Success story of targeted therapy in chronic myeloid leukemia: a population-based study of patients diagnosed in Sweden from 1973 to 2008. J Clin Oncol. 2011;29(18):2514–2520. - PMC - PubMed
    1. Braun WJ, Murdoch DJ. A first course in statistical programming with R. Cambridge: Cambridge University Press; 2007.
    1. Chen Y, Wang H, Kantarjian H, Cortes J. Trends in chronic myeloid leukemia incidence and survival in the United States from 1975 to 2009. Leuk Lymph. 2013;54(7):1411–1417. - PMC - PubMed

Publication types