. 2013 Dec 13;342(6164):1389-1392.
doi: 10.1126/science.1244916.

Fear learning enhances neural responses to threat-predictive sensory stimuli

Affiliations

Fear learning enhances neural responses to threat-predictive sensory stimuli

Marley D Kass et al. Science. .

Abstract

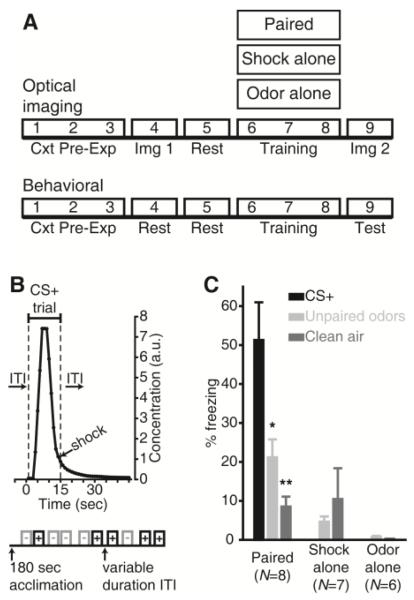
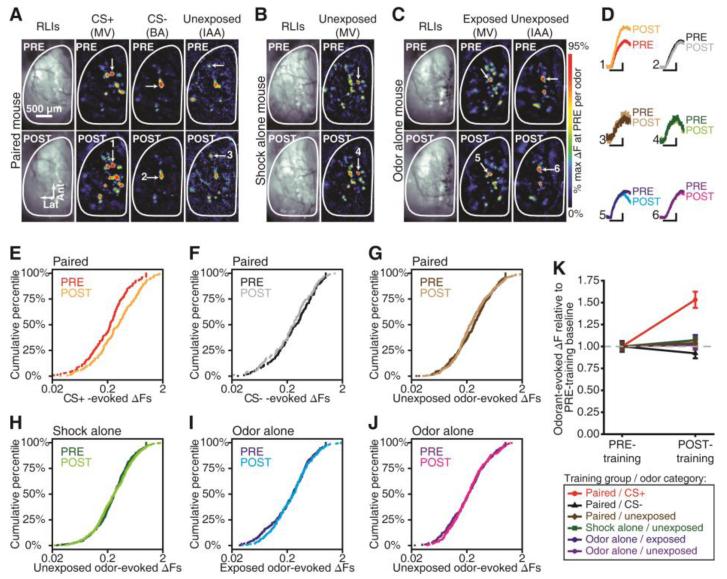
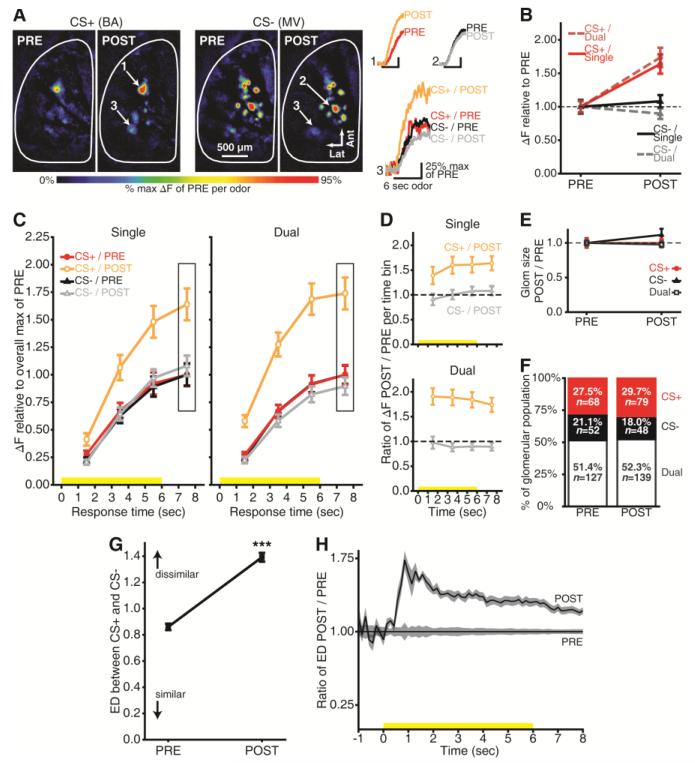
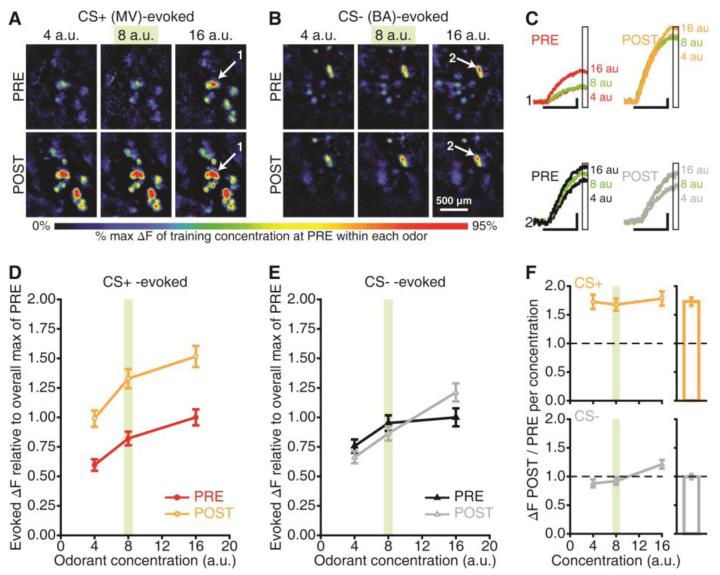
The central nervous system rapidly learns that particular stimuli predict imminent danger. This learning is thought to involve associations between neutral and harmful stimuli in cortical and limbic brain regions, though associative neuroplasticity in sensory structures is increasingly appreciated. We observed the synaptic output of olfactory sensory neurons (OSNs) in individual mice before and after they learned that a particular odor indicated an impending foot shock. OSNs are the first cells in the olfactory system, physically contacting the odor molecules in the nose and projecting their axons to the brain's olfactory bulb. OSN output evoked by the shock-predictive odor was selectively facilitated after fear conditioning. These results indicate that affective information about a stimulus can be encoded in its very earliest representation in the nervous system.


Figures

Fig. 1
Fig. 1
Olfactory fear learning and conditioned freezing. (A) Timeline of experiments. Cxt Pre-Exp, context pre-exposure; Img, imaging. (B) Protocol summary for 1 day of Paired training, with expanded CS+ trial showing the delivery of odorant (arbitrary units, a.u.) and shock stimuli. (C) Mean±SEM percent time freezing during the behavioral test session. *P < 0.05, **P < 0.01 by Bonferroni-corrected post-hoc comparisons; N, mice/group.
Fig. 2
Fig. 2
Fear learning-induced plasticity in odorant-evoked nerve output. (A-C) PRE vs. POST resting light images (RLIs) and pseudocolored difference maps from representative fear conditioned (A), shock alone (B), and odor alone (C) mice. MV, methyl valerate; BA, butyl acetate; IAA, isoamyl acetate. (D) Odorant-evoked change in fluorescence (ΔF) corresponding to callouts in A-C. Scale bars, 6-sec stimulus, 25% max of PRE. (E-J) Cumulative probability plots showing the distributions of PRE vs. POST ΔF values that were evoked by the CS+ (E; P ≤ 0.001), CS (F; P > 0.05), and all other unexposed odorants (G; P > 0.05) in the paired group, all unexposed odorants in the shock alone group (H; P > 0.05), and all exposed (I; P > 0.05) and unexposed (J; P > 0.05) odorants in the odor alone group. P values are by K-S tests. (K) Mean±SEM ΔF pooled across glomeruli (dashed line, baseline). Number (N) of glomeruli contributing to data in E-K: paired, NPRE = 267, NPOST = 285; shock alone, NPRE = 163, NPOST = 173; odor alone, NPRE = 209, NPOST = 180.
Fig. 3
Fig. 3
Stimulus-specific enhancement of nerve output. (A) PRE vs. POST CS+- and CS-evoked maps from a representative mouse. Numbered callouts show example traces from single- and dual -responsive glomeruli. Butyl acetate, BA; methyl valerate, MV. (B) Peak odorant-evoked change in fluorescence (ΔF) separated by selectivity (dashed line, baseline). (C) Time-binned odorant-evoked ΔF for single- and dual-responsive glomeruli. Boxed regions indicate the bin corresponding to peak responses in A-B. Yellow stimulus bars show odorant presentations. (D) Ratio of CS+ and CS-evoked ΔFs during POST / PRE per bin per selectivity category (dashed line, baseline). (E) Glomerulus response size shown relative to PRE (dashed line). (F) Percent of PRE- and POST-training glomerular populations per selectivity category. P > 0.05, by χ2; Ns, number of glomeruli contributing to means±SEM in B-E. (G-H) Example network-level analysis from one mouse. (G) PRE vs. POST mean±SEM Euclidean distance (ED) between CS+- and CS-evoked maps pooled across trial pairs and response times (0-8 sec). ***P < 0.001 by factorial ANOVA. (H) Proportional increase in dissimilarity between odor representations as a function of time. Solid lines±shading, mean±SEM.
Fig. 4
Fig. 4
Enhanced sensitivity to the CS+. (A-B) Maps evoked by 3 concentrations (arbitrary units, a.u.) of the CS+ and CS before and after this mouse underwent fear conditioning. MV, methyl valerate; BA, butyl acetate. (C) Response amplitudes (ΔFs) for callouts (A-B). Scale bars, 6-sec stimulus, 25% max of PRE. Boxed regions indicate the bin used to generate peak maps (A-B) and concentration analyses (D-F). (D-E) PRE vs. POST CS+- and CS-evoked concentration-response functions. (F) Ratio of CS+- and CS-evoked ΔFs during POST / PRE per concentration (dashed lines, baseline). Outsets are scaled to the main y-axis and show overall ratios pooled across concentrations. Data are pooled across glomeruli (mean±SEM) in D-F. The training concentration is indicated in green in A-F.

References

    1. Chen CF, Barnes DC, Wilson DA. J. Neurophysiol. 2011;106:3136–3144. - PMC - PubMed
    1. Doucette W, et al. Neuron. 2011;69:1176–1187. - PMC - PubMed
    1. Edeline JM, Weinberger NM. Behav. Neurosci. 1991;105:618–639. - PubMed
    1. Gdalyahu A, et al. Neuron. 2012;75:121–132. - PMC - PubMed
    1. Kay LM, Laurent G. Nat. Neurosci. 1999;2:1003–1009. - PubMed

Publication types

LinkOut - more resources