. 2013 Dec 11;5(215):215ra172.
doi: 10.1126/scitranslmed.3006597.

PD-1- and CTLA-4-based inhibitory chimeric antigen receptors (iCARs) divert off-target immunotherapy responses

Affiliations

PD-1- and CTLA-4-based inhibitory chimeric antigen receptors (iCARs) divert off-target immunotherapy responses

Victor D Fedorov et al. Sci Transl Med. .

Abstract

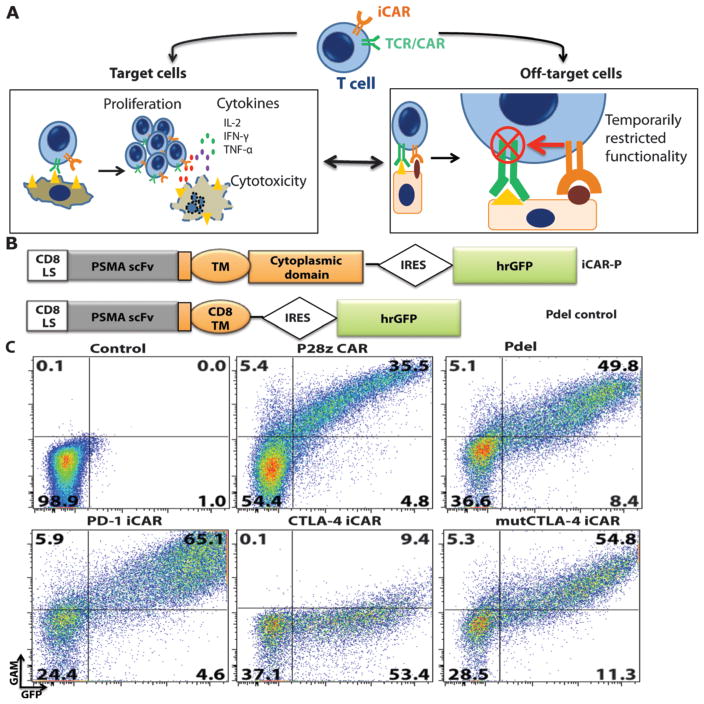
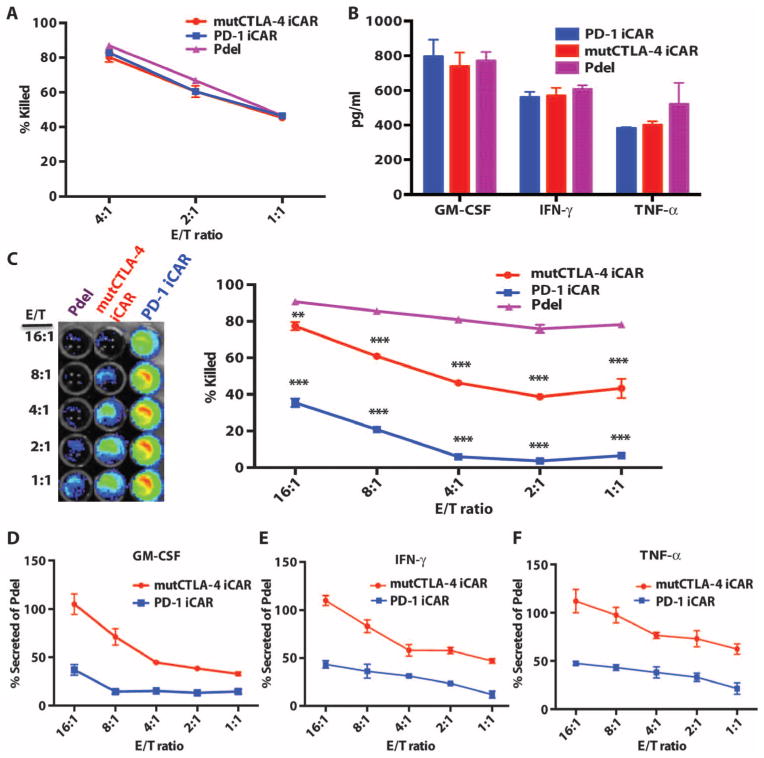
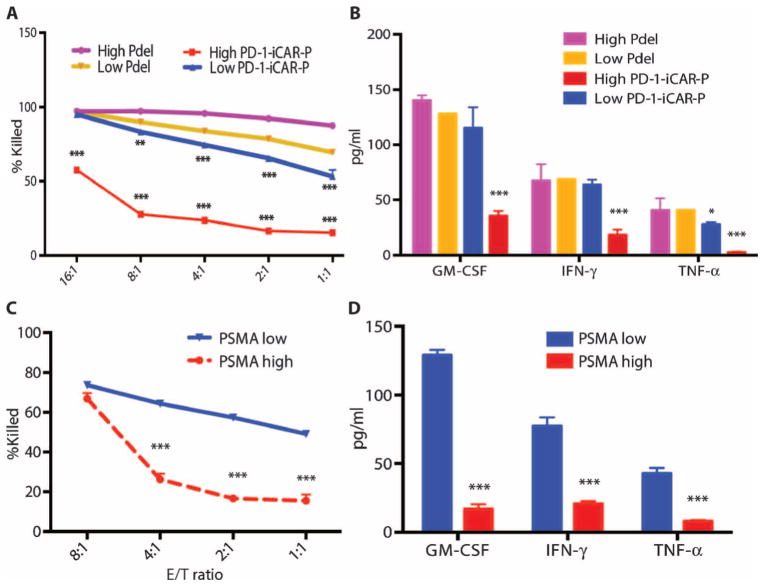
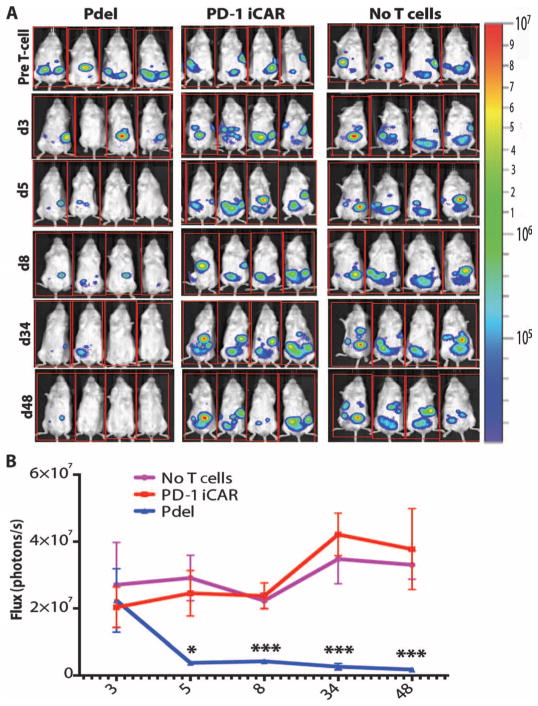
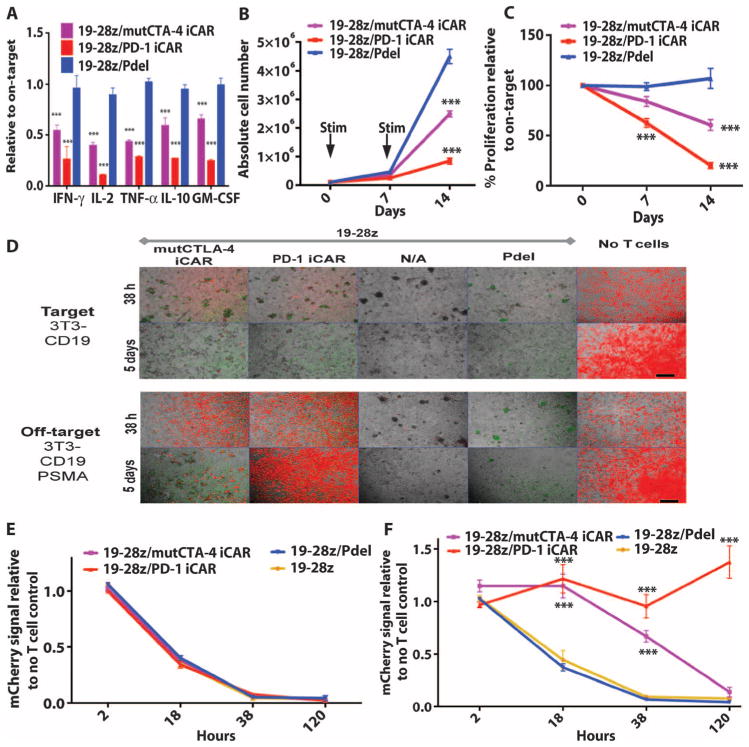
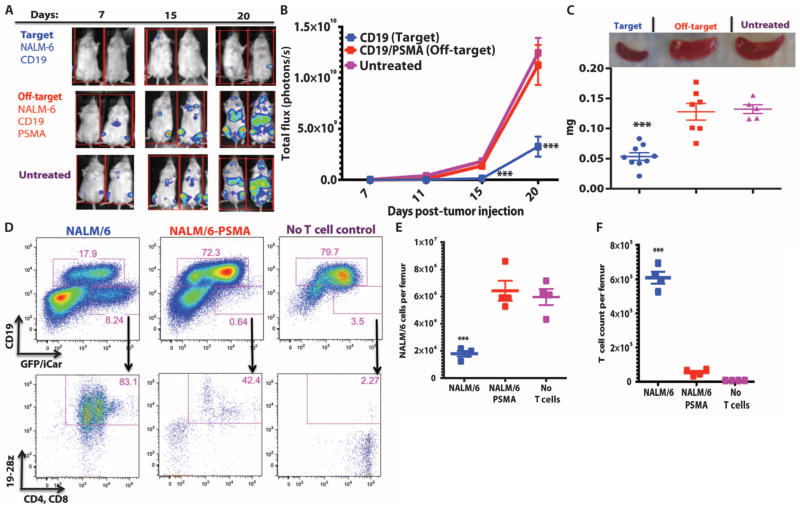
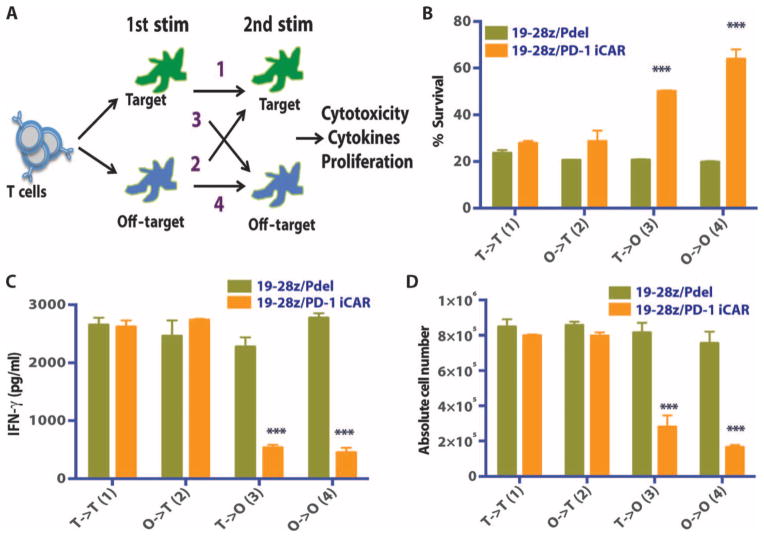
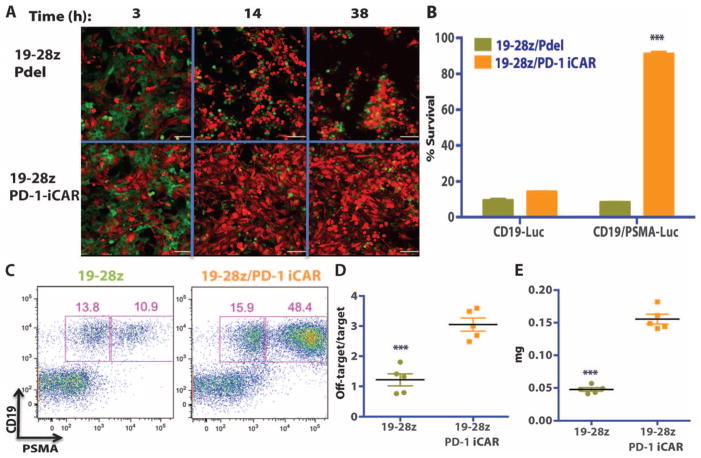
T cell therapies have demonstrated long-term efficacy and curative potential for the treatment of some cancers. However, their use is limited by damage to bystander tissues, as seen in graft-versus-host disease after donor lymphocyte infusion, or "on-target, off-tumor" toxicities incurred in some engineered T cell therapies. Nonspecific immunosuppression and irreversible T cell elimination are currently the only means to control such deleterious responses, but at the cost of abrogating therapeutic benefits or causing secondary complications. On the basis of the physiological paradigm of immune inhibitory receptors, we designed antigen-specific inhibitory chimeric antigen receptors (iCARs) to preemptively constrain T cell responses. We demonstrate that CTLA-4- or PD-1-based iCARs can selectively limit cytokine secretion, cytotoxicity, and proliferation induced through the endogenous T cell receptor or an activating chimeric receptor. The initial effect of the iCAR is temporary, thus enabling T cells to function upon a subsequent encounter with the antigen recognized by their activating receptor. iCARs thus provide a dynamic, self-regulating safety switch to prevent, rather than treat, the consequences of inadequate T cell specificity.


Conflict of interest statement

Competing interests: The authors declare that they have no competing interests. V.D.F. and M.S. have filed a patent pertaining to the results presented in the paper [title: Compositions and methods for immunotherapy, attorney docket number: 92622P(51590)].

Figures

Fig. 1
Fig. 1. iCAR strategy, design, and expression in primary human T cells
(A) T cells with specificity for both tumor and off-target tissues can be restricted to tumor only by using an antigen-specific iCAR introduced into the T cells to protect the off-target tissue. (B) Schematic diagram of the bicistronic vectors used for iCARs and Pdel. iCAR-P: a spacer, transmembrane, and intracellular tail of each inhibitory receptor were cloned into a previously described retroviral vector having a CD8 leader sequence (LS). IRES, internal ribosomal entry site; hrGFP, humanized Renilla green fluorescent protein reporter. A Pdel control vector was designed with a spacer and CD8 transmembrane (TM) domain, and lacking an intracellular tail. (C) Cell surface expression of the iCARs was assessed by flow cytometry in transduced primary human T cells. Dot plots are representative of eight different donors. GAM, goat anti-mouse immunoglobulin G F(ab′)2 antibody that binds to the murine-derived extracellular domain of the CAR.
Fig. 2
Fig. 2. iCARs protect iPS-fib from TCR-mediated allogeneic reactions
Control Pdel- or iCAR-transduced T cells primed with allogeneic moDCs were incubated with iPS-derived fibroblasts (iPS-fib) expressing click beetle luciferase (CBL), isogenic to the moDCs, using a range of E/T ratios. (A) Pdel-, PD-1–, or mutCTLA-4 iCAR-P–transduced T cells reacting against target iPS-fib (n = 3 per condition). Killing of the iPS-fib was quantified with the Bright-Glo assay system. (B) Cytokine secretion in cell culture supernatants from (A) at 4:1 E/T ratio was assessed at 18 hours. GM-CSF, granulocyte-macrophage colony-stimulating factor; IFN-γ, interferon-γ; TNF-α, tumor necrosis factor-α. (C) Pdel- or iCAR-positive T cells were incubated for 24 hours with off-target iPS-fib expressing PSMA (iPS-fib-PSMA), and luciferase signal (left) was quantified (right) (n = 3 for each condition). (D to F) Cytokine secretion measured at 24 hours in cell culture supernatants from (C). Error bars represent ±SEM. *P < 0.01, ***P < 0.001 by analysis of variance (ANOVA) comparing iCARs to Pdel and post hoc analysis with multiple t tests corrected with the Holm-Sidak method. Raw data and P values are provided in the Supplementary Materials.
Fig. 3
Fig. 3. iCARs function in a stoichiometric manner
(A) Pdel- or PD-1 iCAR-P–transduced alloreactive T cells were sorted for high or low expression of each respective receptor, as shown in fig. S5A, and were seeded on iPS-fib-PSMA–expressing CBL. Killing of iPS-fib-PSMA relative to untreated cells was assessed with the Bright-Glo assay system (n = 3 for each condition). (B) Cytokine secretion, measured at 24 hours in the cell culture supernatant from (A) at 4:1 E/T ratio. (C) PD-1 iCAR-P–transduced alloreactive T cells were incubated with iPS-fib-PSMA sorted for high or low levels of PSMA expression as shown in fig. S5B. Killing of each population relative to untreated cells was quantified with the Bright-Glo assay system (n = 3 per condition). D) Cytokines from (C) were assessed at 24 hours. Error bars represent ±SEM. ***P < 0.001 by Student’s t test. Error bars represent ±SEM. *P < 0.01, ***P < 0.001 by ANOVA comparing to high Pdel group and post hoc analysis with multiple t tests corrected with the Holm-Sidak method. Raw data and P values are provided in the Supplementary Materials.
Fig. 4
Fig. 4. iCARs limit allogeneic responses in vivo
NOD/SCID/γc mice were injected intraperitoneally with 1 × 10⁶ iPS-derived fibroblasts expressing CBL/PSMA (iPS-fib-PSMA) and, 7 days later, were treated intraperitoneally with 5 × 10⁵ PD-1 iCAR-P– or Pdel-transduced, sorted, alloreactive T cells. Untreated mice (no T cells) were used as control. (A) Survival of iPS-fib-PSMA was assessed by BLI before and at selected time points after T cell infusion. Images of four representative mice from each group are shown. (B) Total body flux (photons per second) for each mouse was quantified and averaged per group (n = 5 per group). Error bars represent ±SEM. *P < 0.05, **P < 0.01 by ANOVA comparing to Pdel and post hoc analysis with multiple t tests corrected with the Holm-Sidak method. Raw data and P values are provided in the Supplementary Materials.
Fig. 5
Fig. 5. iCARs inhibit human T cell cytokine release, proliferation, and target cell elimination driven by 19-28z CAR
(A) Luminex multiplex cytokine analysis of culture supernatant 24 hours after seeding dual-sorted 19-28z/Pdel– or 19-28z/iCAR–transduced human T cells on 3T3-CD19 (target) or 3T3-CD19-PSMA (off-target) AAPCs. The data are represented as a ratio of off-target/target values and pooled from three independent experiments (n = 6 wells per condition). Error bars represent ±SEM. **P < 0.01, ***P < 0.001 by ANOVA comparing iCARs to Pdel and post hoc analysis with multiple t tests corrected with the Holm-Sidak method. (B) Absolute counts of 19-28z/Pdel or 19-28z/iCAR T cells stimulated on days 0 and 7 with off-target AAPCs. No exogenous cytokines were added. Data are representative of six independent experiments. (C) Proliferation of 19-28z/Pdel or 19-28z/iCAR T cells stimulated on days 0 and 7 with off-target AAPCs relative to proliferation on target AAPCs. No exogenous cytokines were added. Data are representative of six independent experiments. (D) T cells seeded at a 1:1 ratio on target and off-target mCherry+ AAPCs. Images at 38 hours and 5 days from one of five independent experiments are shown. Scale bars, 0.5 mm. (E and F) Quantification of mCherry signal from (D) against CD19 targets (E) or CD19-PSMA off-target cells (F), as described in Materials and Methods. Error bars represent ±SEM. **P < 0.01, ***P < 0.001 by Student’s t test. Raw data and P values are provided in the Supplementary Materials.
Fig. 6
Fig. 6. iCARs restrict 19-28z CAR target cell specificity in vivo
(A) BLI depicting the tumor progress of NALM/6 or NALM/6-PSMA in NOD/SCID/γc mice treated with sorted 19-28z/PD-1 iCAR-P T cells. Untreated mice (no T cells) were used as control. (B) Tumor burden for each mouse was quantified, and average total flux per group is shown. (C) Spleen weight of mice from (A) sacrificed at day 21. Each dot represents one recipient mouse. (D) Flow cytometric analysis of the femur bone marrow from (C) for the presence of tumor cells (CD19+GFP+) and T cells (CD1919-28z/GFP+CD4+CD8+). 19-28z expression was assessed by staining for LNGFR receptor whose complementary DNA (cDNA) is linked to 19-28z and is used as a detection marker. (E and F) Absolute numbers of tumor cells (E) and of CD1919-28z/GFP+CD4+CD8+ T cells (F) in the spleens from (C) were quantified by flow cytometry with CountBright beads (n = 4). Error bars represent ±SEM. **P < 0.01, ***P < 0.001 by Student’s t test.
Fig. 7
Fig. 7. iCAR function is temporary and reversible
(A) 19-28z/Pdel or 19-28z/PD-1 iCAR-P T cells were incubated with target (T) or off-target (O) AAPCs for the first stimulation. After 3 or 7 days, the cells from each group were restimulated with either target [T→T (1) or O→T (2)] or off-target [T→O (3) or O→O (4)] AAPCs in a crisscross manner to analyze the effects of the first stimulation on subsequent T cell function. (B) Killing of target (T) or off-target (O) AAPCs at 24 hours after incubation with each T cell group (second stimulation) was analyzed with the Bright-Glo assay system (n = 3 for each condition). (C) Secretion of effector cytokines in the cell culture supernatant from (B) was analyzed 24 hours after the second stimulation, and interferon-γ (IFN-γ) is shown as a representative result (n = 3 for each condition). (D) T cell proliferation at day 7 after the second stimulation (n = 3 for each condition). Error bars represent ±SEM. Statistical comparison was performed within each condition (that is, T→T Pdel versus PD-1 iCAR-P). ***P < 0.001 by Student’s t test.
Fig. 8
Fig. 8. iCAR- and CAR-expressing T cells discern targets in vitro and vivo
(A) 19-28z/Pdel or 19-28z/PD-1 iCAR-P T cells were incubated with a 1:1 mix of target (CD19+GFP+, green) and off-target (CD19+PSMA+mCherry+, red) AAPCs, and time-lapse microscopy was used to visualize real-time killing of each population for 38 hours. Representative images are shown, and full-length movies are available in movie S1 (A and B). Scale bars, 0.1 mm. (B) As in (A), 19-28z/Pdel or 19-28z/PD-1 iCAR-P T cells were incubated with a 1:1 mix of target (CD19+) and off-target (CD19+PSMA+) AAPCs. Killing of each AAPC population was assessed in parallel experiments where one of each AAPC type was labeled with CBL (CD19+CBL+/CD19+PSMA+ mix or CD19+/CD19+PSMA+CBL+ mix). Killing was quantified with the Bright-Glo assay system at 38 hours (n = 3 for each condition). (C to E) NOD/SCID/γc mice were injected with a 1:1 mixture of NALM/6 and NALM/6-PSMA cells and treated with 19-28z or 19-28z/PD-1 iCAR-P T cells. (C) Upon sacrifice, the presence of the target and off-target NALM/6 cells in the bone marrow was analyzed by flow cytometry. (D) Ratio of target/off-target NALM/6 cells in the bone marrow of sacrificed mice was quantified by flow cytometry. (E) Spleen weight of treated mice was also recorded at sacrifice. Error bars represent ±SEM. ***P < 0.001 by Student’s t test.

References

    1. Blattman JN, Greenberg PD. Cancer immunotherapy: A treatment for the masses. Science. 2004;305:200–205. - PubMed
    1. Restifo NP, Dudley ME, Rosenberg SA. Adoptive immunotherapy for cancer: Harnessing the T cell response. Nat Rev Immunol. 2012;12:269–281. - PMC - PubMed
    1. Sadelain M, Brentjens R, Rivière I. The promise and potential pitfalls of chimeric antigen receptors. Curr Opin Immunol. 2009;21:215–223. - PMC - PubMed
    1. Turtle CJ, Hudecek M, Jensen MC, Riddell SR. Engineered T cells for anti-cancer therapy. Curr Opin Immunol. 2012;24:633–639. - PMC - PubMed
    1. Blazar BR, Murphy WJ, Abedi M. Advances in graft-versus-host disease biology and therapy. Nat Rev Immunol. 2012;12:443–458. - PMC - PubMed

Publication types

MeSH terms