

Inhibition of LINE-1 retrotransposon-encoded reverse transcriptase modulates the expression of cell differentiation genes in breast cancer cells
- PMID: 24337508
- PMCID: PMC3889873
- DOI: 10.1007/s10549-013-2812-7
Inhibition of LINE-1 retrotransposon-encoded reverse transcriptase modulates the expression of cell differentiation genes in breast cancer cells
Abstract
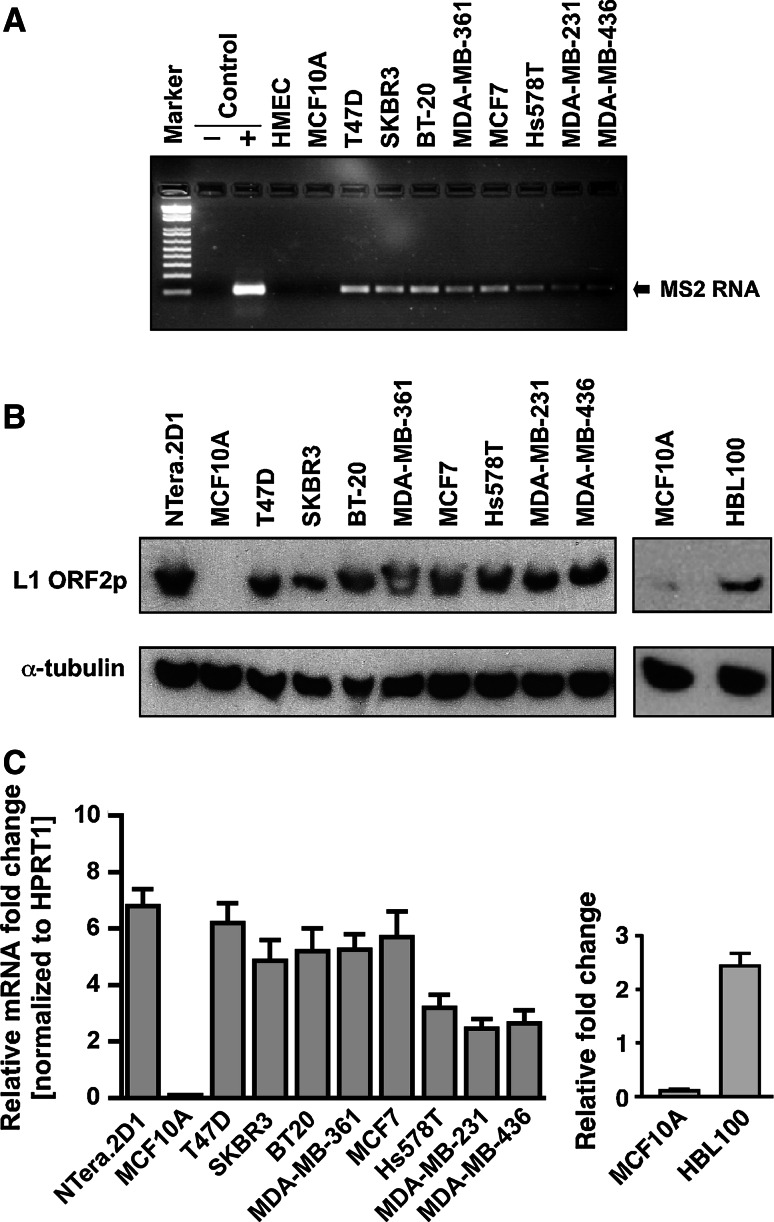
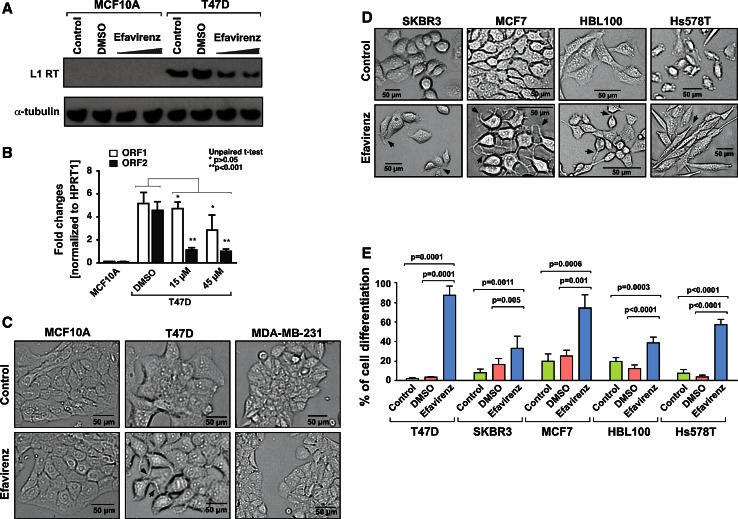
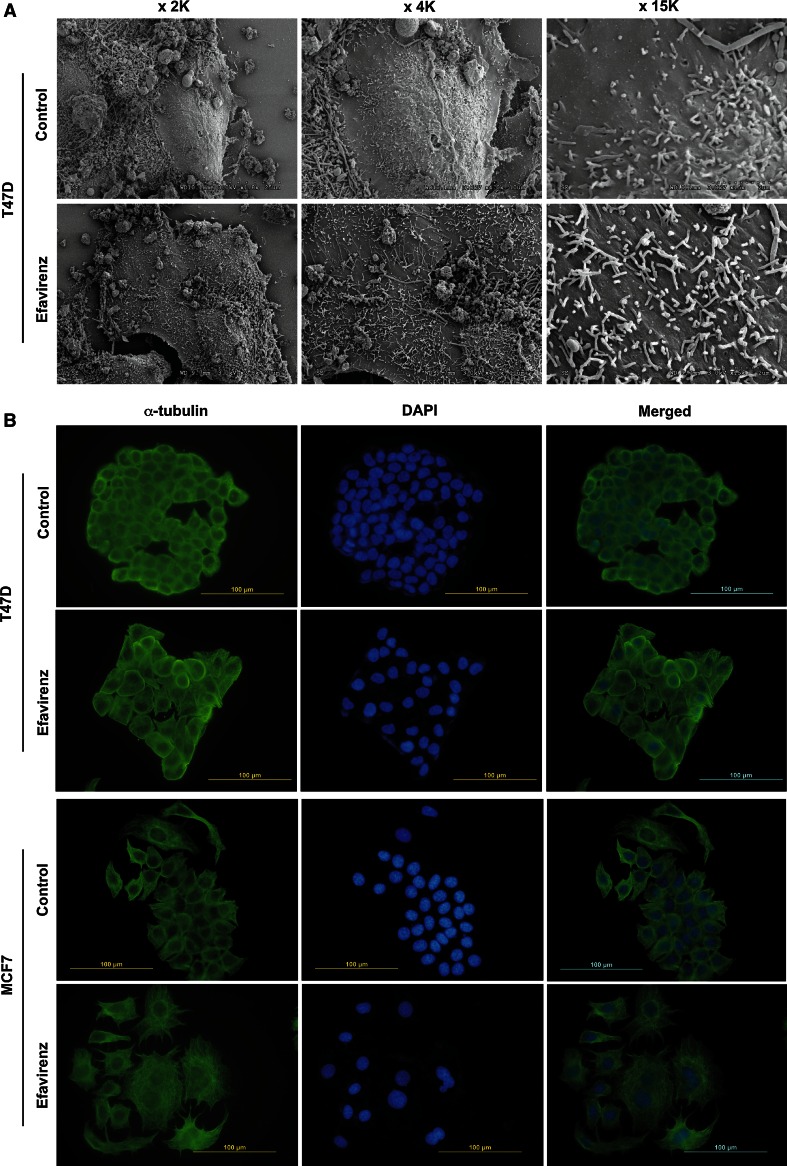
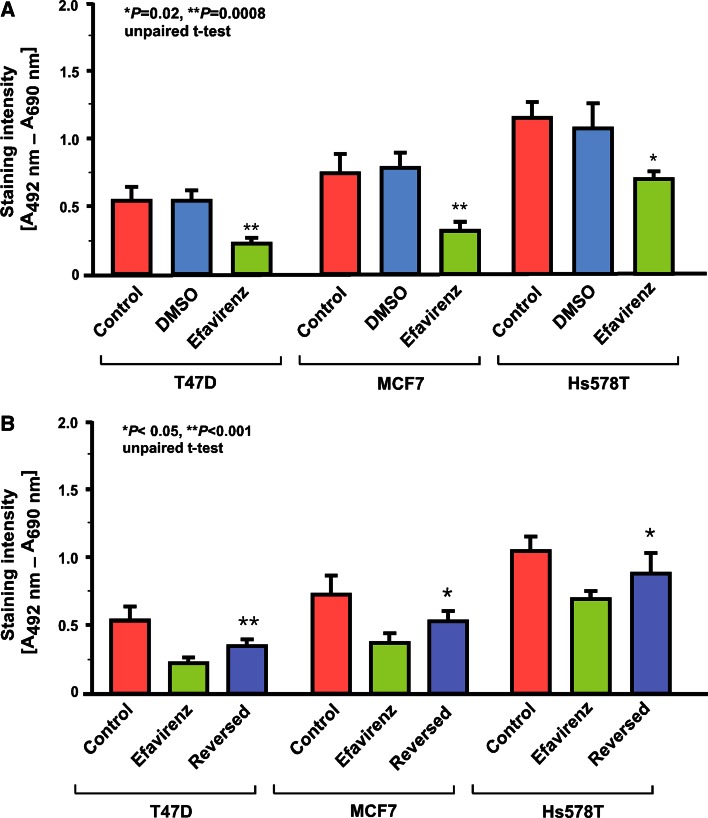
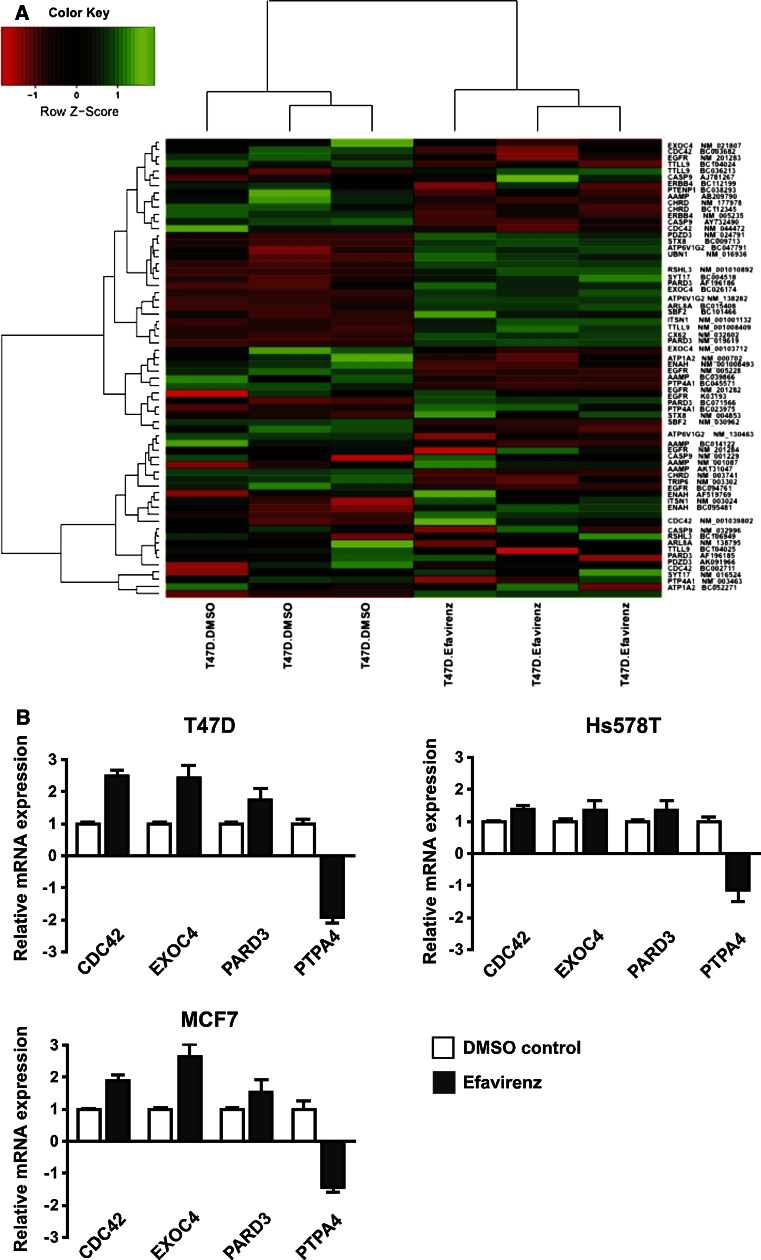
Long Interspersed Elements (L1 elements) are biologically active retrotransposons that are capable of autonomous replication using their own reverse transcriptase (RT) enzyme. Expression of the normally repressed RT has been implicated in cancer cell growth. However, at present, little is known about the expression of L1-encoded RT activity or the molecular changes that are associated with RT activity in the development of breast cancer. Here, we report that RT activity is widespread in breast cancer cells. The expression of RT protein decreased markedly in breast cancer cells after treatment with the antiretroviral drug, efavirenz. While the majority of cells showed a significant reduction in proliferation, inhibition of RT was also accompanied by cell-specific differences in morphology. MCF7 cells displayed elongated microtubule extensions that adhered tightly to their substrate, while a large fraction of the T47D cells that we studied formed long filopodia projections. These morphological changes were reversible upon cessation of RT inhibition, confirming their dependence on RT activity. We also carried out gene expression profiling with microarrays and determined the genes that were differentially expressed during the process of cellular differentiation. Genes involved in proliferation, cell migration, and invasive activity were repressed in RT-inhibited cells. Concomitantly, genes involved in cell projection, formation of vacuolar membranes, and cell-to-cell junctions were significantly upregulated in RT-inhibited cells. qRT-PCR examination of the mRNA expression of these genes in additional cell lines yielded close correlation between their differential expression and the degree of cellular differentiation. Our study demonstrates that the inhibition of L1-encoded RT can reduce the rate of proliferation and promote differentiation of breast cancer cells. Together, these results provide a direct functional link between the expression of L1 retrotransposons and the development of breast cancer.
Figures
Similar articles
-
Regulatory roles of LINE-1-encoded reverse transcriptase in cancer onset and progression.Oncotarget. 2014 Sep 30;5(18):8039-51. doi: 10.18632/oncotarget.2504. Oncotarget. 2014. PMID: 25478632 Free PMC article. Review.
-
A tumor-promoting mechanism mediated by retrotransposon-encoded reverse transcriptase is active in human transformed cell lines.Oncotarget. 2013 Dec;4(12):2271-87. doi: 10.18632/oncotarget.1403. Oncotarget. 2013. PMID: 24345856 Free PMC article.
-
Effect of reverse transcriptase inhibitors on LINE-1 and Ty1 reverse transcriptase activities and on LINE-1 retrotransposition.BMC Biochem. 2011 May 5;12:18. doi: 10.1186/1471-2091-12-18. BMC Biochem. 2011. PMID: 21545744 Free PMC article.
-
Reverse transcriptase inhibitors promote the remodelling of nuclear architecture and induce autophagy in prostate cancer cells.Cancer Lett. 2020 May 28;478:133-145. doi: 10.1016/j.canlet.2020.02.029. Epub 2020 Feb 26. Cancer Lett. 2020. PMID: 32112906
-
LINE-1-encoded reverse Transcriptase as a target in cancer therapy.Front Biosci (Landmark Ed). 2018 Mar 1;23(7):1360-1369. doi: 10.2741/4648. Front Biosci (Landmark Ed). 2018. PMID: 29293438 Review.
Cited by
-
Regulatory roles of LINE-1-encoded reverse transcriptase in cancer onset and progression.Oncotarget. 2014 Sep 30;5(18):8039-51. doi: 10.18632/oncotarget.2504. Oncotarget. 2014. PMID: 25478632 Free PMC article. Review.
-
Prospects for breast cancer immunotherapy using microRNAs and transposable elements as objects.Explor Target Antitumor Ther. 2024;5(5):1011-1026. doi: 10.37349/etat.2024.00261. Epub 2024 Aug 6. Explor Target Antitumor Ther. 2024. PMID: 39351441 Free PMC article. Review.
-
Restricting retrotransposons: a review.Mob DNA. 2016 Aug 11;7:16. doi: 10.1186/s13100-016-0070-z. eCollection 2016. Mob DNA. 2016. PMID: 27525044 Free PMC article. Review.
-
Retrotransposition in tumors and brains.Mob DNA. 2014 Apr 7;5:11. doi: 10.1186/1759-8753-5-11. eCollection 2014. Mob DNA. 2014. PMID: 24708615 Free PMC article.
-
Crossing the LINE Toward Genomic Instability: LINE-1 Retrotransposition in Cancer.Front Chem. 2015 Dec 16;3:68. doi: 10.3389/fchem.2015.00068. eCollection 2015. Front Chem. 2015. PMID: 26734601 Free PMC article. Review.
References
Publication types
MeSH terms
Substances
LinkOut - more resources
Full Text Sources
Other Literature Sources
Medical
