. 2014 Feb 7;289(6):3652-65.
doi: 10.1074/jbc.M113.512459. Epub 2013 Dec 12.

N-terminal acetylation stabilizes N-terminal helicity in lipid- and micelle-bound α-synuclein and increases its affinity for physiological membranes

Affiliations

N-terminal acetylation stabilizes N-terminal helicity in lipid- and micelle-bound α-synuclein and increases its affinity for physiological membranes

Igor Dikiy et al. J Biol Chem. .

Abstract

The Parkinson disease protein α-synuclein is N-terminally acetylated, but most in vitro studies have been performed using unacetylated α-synuclein. Binding to lipid membranes is considered key to the still poorly understood function of α-synuclein. We report the effects of N-terminal acetylation on α-synuclein binding to lipid vesicles of different composition and curvature and to micelles composed of the detergents β-octyl-glucoside (BOG) and SDS. In the presence of SDS, N-terminal acetylation results in a slightly increased helicity for the N-terminal ~10 residues of the protein, likely due to the stabilization of N-terminal fraying through the formation of a helix cap motif. In the presence of BOG, a detergent used in previous isolations of helical oligomeric forms of α-synuclein, the N-terminally acetylated protein adopts a novel conformation in which the N-terminal ~30 residues bind the detergent micelle in a partly helical conformation, whereas the remainder of the protein remains unbound and disordered. Binding of α-synuclein to lipid vesicles with high negative charge content is essentially unaffected by N-terminal acetylation irrespective of curvature, but binding to vesicles of lower negative charge content is increased, with stronger binding observed for vesicles with higher curvature. Thus, the naturally occurring N-terminally acetylated form of α-synuclein exhibits stabilized helicity at its N terminus and increased affinity for lipid vesicles similar to synaptic vesicles, a binding target of the protein in vivo. Furthermore, the novel BOG-bound state of N-terminally acetylated α-synuclein may serve as a model of partly helical membrane-bound intermediates with a role in α-synuclein function and dysfunction.

Keywords: Lipid-binding Protein; N-terminal Acetylation; Parkinson Disease; Post Translational Modification; Protein Aggregation; Synuclein; α-Synuclein.


Figures

FIGURE 1.
FIGURE 1.
N-terminal acetylation affects N-terminal structure of SDS-bound form of aSyn. A, overlay of 1H,15N-HSQC spectra of unmodified aSyn (black) and Ac-aSyn (red), both in the presence of 40 mm SDS. B, averaged chemical shift difference of the amide cross-peak (Δδamide = √(½(ΔδHN2 + (ΔδN/5)2)) between Ac-aSyn and unmodified aSyn in the presence of 40 mm SDS plotted versus residue number. The red line indicates a three-residue average. C, α-carbon secondary shifts for unmodified aSyn (black) and Ac-aSyn (red) in the presence of 40 mm SDS plotted versus residue number. Positive values indicate α-helix and negative values extended structure. The black and red lines show three-residue averages. D, amide proton exchange for unmodified aSyn (black) and Ac-aSyn (red) in the presence of 40 mm SDS at pH 8.4 (see “Experimental Procedures”). Higher values indicated increased protection from exchange. Peaks that were not visible at pH 8.4 were assigned a ratio of −1. The black and red lines show three-residue averages.
FIGURE 2.
FIGURE 2.
BOG induces helical structure in unmodified and Ac-aSyn. Overlay of CD spectra from 200 to 260 nm from two separate titrations of unmodified (A) and Ac-aSyn (B) with BOG. The ellipticity is normalized to protein concentration and number of residues. C, plot of mean residue ellipticity at 222 nm (indicative of helical structure) of unmodified (black) and Ac-aSyn (red) as a function of BOG concentration. Data points are combined from two independent titrations and fit to Equation 1.
FIGURE 3.
FIGURE 3.
N-terminally acetylated and unmodified aSyn undergo different transitions upon the addition of BOG. A, selected regions of overlaid 1H,15N-HSQC spectra of Ac-aSyn and unmodified aSyn with increasing BOG concentrations highlighting the amide cross-peaks for valine 15 (left) and alanine 17 (right). Spectral colors and approximate BOG concentrations are as follows: violet, 0 mm BOG; cyan, 25 mm BOG (only Ac-aSyn), green, 50 mm BOG; orange, 75 mm BOG (only Ac-aSyn); red, 100 mm BOG; blue, 200 mm BOG; black, 300 mm BOG. B, averaged chemical shift difference (from 0 mm BOG spectrum) of amide cross-peak (Δδamide = √(½(ΔδHN2 + (ΔδN/5)2)) versus BOG concentration for valine 15 and alanine 17. Red points correspond to Ac-aSyn, and black points correspond to unmodified aSyn. C, averaged chemical shift difference (from 0 mm BOG) of the amide cross-peak (Δδamide = √(½(ΔδHN2 + (ΔδN/5)2)) versus residue number for Ac-aSyn at increasing BOG concentrations. Colors are as in A. D, averaged chemical shift difference (from 0 mm BOG) of the amide cross-peak (Δδamide = √(½(ΔδHN2 + (ΔδN/5)2)) versus residue number for unmodified aSyn at increasing BOG concentrations. Colors are as in A.
FIGURE 4.
FIGURE 4.
BOG micelles induce a partly helical conformation in N-terminally acetylated aSyn. A, overlay of 1H,15N-HSQC spectra of Ac-aSyn without (blue) and with (red) 100 mm BOG. B, averaged chemical shift difference of amide cross-peak (Δδamide = √(½(ΔδHN2 + (ΔδN/5)2)) between Ac-aSyn with and without 100 mm BOG plotted versus residue number. The red line indicates a three-residue average. C, α-carbon secondary shifts for Ac-aSyn without BOG (blue) and in the presence of 100 mm BOG (red) or 300 mm 2H BOG (magenta) plotted versus residue number. Positive values indicate α-helix, and negative values indicate extended structure. The blue, red, and magenta lines show three-residue averages. Only the N-terminal 40 residues are shown for 300 mm BOG.
FIGURE 5.
FIGURE 5.
N-terminally acetylated aSyn binds BOG micelles. A, amide nitrogen R2 relaxation rates for Ac-aSyn in the presence of 100 mm BOG plotted versus residue number. The red line indicates a three-residue average. B, the ratio of peak intensity for Ac-aSyn in the presence of paramagnetically doped BOG micelles to the peak intensity of Ac-aSyn in the presence of diamagnetic BOG micelles plotted versus residue number. The red line indicates a five-residue average.
FIGURE 6.
FIGURE 6.
N-terminal acetylation increases aSyn binding to moderately charged lipid vesicles. Plots show the ratio of peak intensity in the presence of lipid vesicles (22:1 lipid:protein ratio) to the peak intensity in the absence of lipids versus residue number for unmodified (black) and Ac-aSyn (red). Vesicle compositions and sizes are 50% DOPS/35% DOPC/15% DOPE LUVs (A) and SUVs (B) and 15% DOPS/60% DOPC/25% DOPE LUVs (C) and SUVs (D).
FIGURE 7.
FIGURE 7.
Increased binding of Ac-aSyn to moderately charged vesicles is evident at different protein-to-lipid ratios. Intensity ratios of peaks in the presence of different concentrations of lipid vesicles to peaks in the absence of lipids versus residue number for 100 μm unmodified aSyn (left) and Ac-aSyn (right). Vesicle compositions and sizes are 50% DOPS/35% DOPC/15% DOPE LUVs (A and B), 50% DOPS/35% DOPC/15% DOPE SUVs (C and D), 15% DOPS/60% DOPC/25% DOPE LUVs (E and F), and 15% DOPS/60% DOPC/25%DOPE SUVs (G and H). Colors and approximate lipid concentrations are as follows: blue, 0.75 mm; black, 1.5 mm; red, 3 mm; green, 9 mm. The 3 mm lipid data include error bars (orange) that depict the deviation between two independent measurements on the same sample.
FIGURE 8.
FIGURE 8.
N-terminal acetylation increases the apparent affinity of aSyn to lipid vesicles in different binding modes. Plots of bound fractions (points) fit to bimolecular binding curves (lines) of all bound states (squares, solid lines) and the extended helix state (circles, dashed lines) versus lipid concentration for unmodified (black) and Ac-aSyn (red). Vesicle compositions and sizes are 50% DOPS/35% DOPC/15% DOPE LUVs (A) and SUVs (B) and 15% DOPS/60% DOPC/25% DOPE LUVs (C) and SUVs (D).
FIGURE 9.
FIGURE 9.
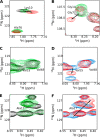
Decreased N-terminal charge in unmodified aSyn does not recapitulate the effects of N-terminal acetylation on SDS or BOG binding. Selected regions of overlaid 1H,15N-HSQC spectra of Ac-aSyn and unmodified aSyn with and without SDS (40 mm) or BOG (100 mm) highlighting the amide cross-peaks for lysine 10 (A), glycine 7 (B), valine 15 (C and D), and alanine 17 (E and F). In the top two panels (A and B), unmodified aSyn with SDS at pH 6.8 is in black, Ac-aSyn with SDS at pH 6.8 is in red, and unmodified aSyn with SDS at pH 8.4 is in green. Arrows highlight peak shifts in the SDS-bound spectrum upon acetylation, which are not observed upon raising the pH for the unmodified protein. In the bottom four panels (C–F), unmodified aSyn (C and E) with 100 mm BOG at pH 6.8 (black) is compared with unmodified aSyn with 100 mm BOG at pH 8.4 (green), whereas Ac-aSyn (D and F) in buffer at pH 6.8 (blue) is compared with Ac-aSyn with 100 mm BOG at pH 6.8 (red). Arrows highlight peak shifts indicative of Ac-aSyn binding to BOG micelles, which are not observed upon raising the pH for the unmodified protein. Note that some peaks disappear in the high pH spectra due to increased amide proton exchange.

References

    1. Arnesen T., Van Damme P., Polevoda B., Helsens K., Evjenth R., Colaert N., Varhaug J. E., Vandekerckhove J., Lillehaug J. R., Sherman F., Gevaert K. (2009) Proteomics analyses reveal the evolutionary conservation and divergence of N-terminal acetyltransferases from yeast and humans. Proc. Natl. Acad. Sci. U.S.A. 106, 8157–8162 - PMC - PubMed
    1. Hwang C.-S., Shemorry A., Varshavsky A. (2010) N-terminal acetylation of cellular proteins creates specific degradation signals. Science 327, 973–977 - PMC - PubMed
    1. Jarvis J. A., Ryan M. T., Hoogenraad N. J., Craik D. J., Høj P. B. (1995) Solution structure of the acetylated and noncleavable mitochondrial targeting signal of rat chaperonin 10. J. Biol. Chem. 270, 1323–1331 - PubMed
    1. Kimura Y., Takaoka M., Tanaka S., Sassa H., Tanaka K., Polevoda B., Sherman F., Hirano H. (2000) nα-α-Acetylation and proteolytic activity of the yeast 20 S proteasome. J. Biol. Chem. 275, 4635–4639 - PubMed
    1. Scott D. C., Monda J. K., Bennett E. J., Harper J. W., Schulman B. A. (2011) N-terminal acetylation acts as an avidity enhancer within an interconnected multiprotein complex. Science 334, 674–678 - PMC - PubMed

Publication types

LinkOut - more resources