

Dynamic transcriptional response of Escherichia coli to inclusion body formation
- PMID: 24338599
- PMCID: PMC3969792
- DOI: 10.1002/bit.25169
Dynamic transcriptional response of Escherichia coli to inclusion body formation
Abstract
Escherichia coli is used intensively for recombinant protein production, but one key challenge with recombinant E. coli is the tendency of recombinant proteins to misfold and aggregate into insoluble inclusion bodies (IBs). IBs contain high concentrations of inactive recombinant protein that require recovery steps to salvage a functional recombinant protein. Currently, no universally effective method exists to prevent IB formation in recombinant E. coli. In this study, DNA microarrays were used to compare the E. coli gene expression response dynamics to soluble and insoluble recombinant protein production. As expected and previously reported, the classical heat-shock genes had increased expression due to IB formation, including protein folding chaperones and proteases. Gene expression levels for protein synthesis-related and energy-synthesis pathways were also increased. Many transmembrane transporter and corresponding catabolic pathways genes had decreased expression for substrates not present in the culture medium. Additionally, putative genes represented over one-third of the genes identified to have significant expression changes due to IB formation, indicating many important cellular responses to IB formation still need to be characterized. Interestingly, cells grown in 3% ethanol had significantly reduced gene expression responses due to IB formation. Taken together, these results indicate that IB formation is complex, stimulates the heat-shock response, increases protein and energy synthesis needs, and streamlines transport and catabolic processes, while ethanol diminished all of these responses.
Keywords: DNA microarrays; ethanol; inclusion bodies; protein aggregates; stress.
© 2014 Wiley Periodicals, Inc.
Figures
 ,
,
 ), GFPCAT (
 ,
,
 ), and ethanol-treated VP1GFP (
 ,
,
 ). Uninduced (,
, )
and Induced (, ,
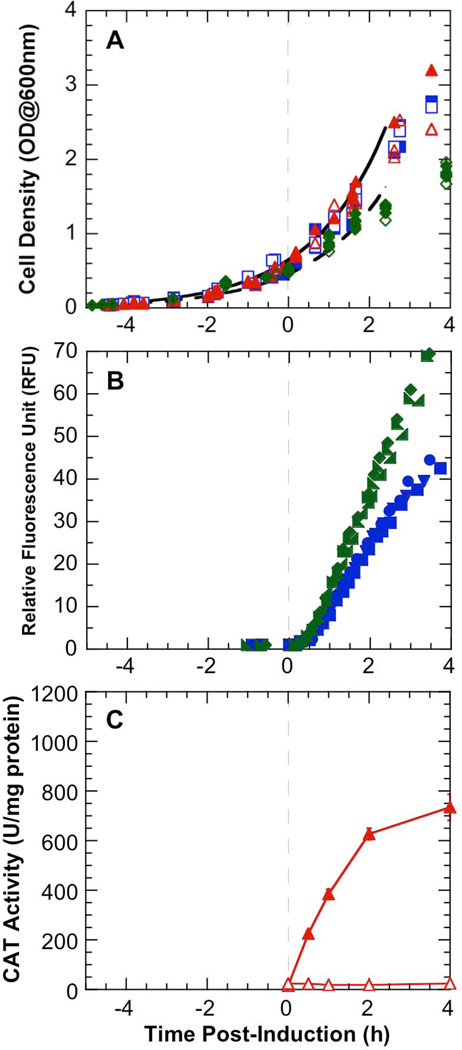
). B) Fluorescent profiles for induced
E. coli VP1GFP (,
). Uninduced (,
, )
and Induced (, ,
). B) Fluorescent profiles for induced
E. coli VP1GFP (,
 ,
,  )
and ethanol-treated induced E. coli VP1GFP (,
)
and ethanol-treated induced E. coli VP1GFP (,
 ,
,  )
cultures. Triplicate data are shown. C) Specific CAT activity profiles for
E. coli GFPCAT Uninduced ()
and Induced () cultures. Error bars represent 95%
confidence intervals. Cultures were synchronized to Time 0 at the time of
induction.
)
cultures. Triplicate data are shown. C) Specific CAT activity profiles for
E. coli GFPCAT Uninduced ()
and Induced () cultures. Error bars represent 95%
confidence intervals. Cultures were synchronized to Time 0 at the time of
induction.
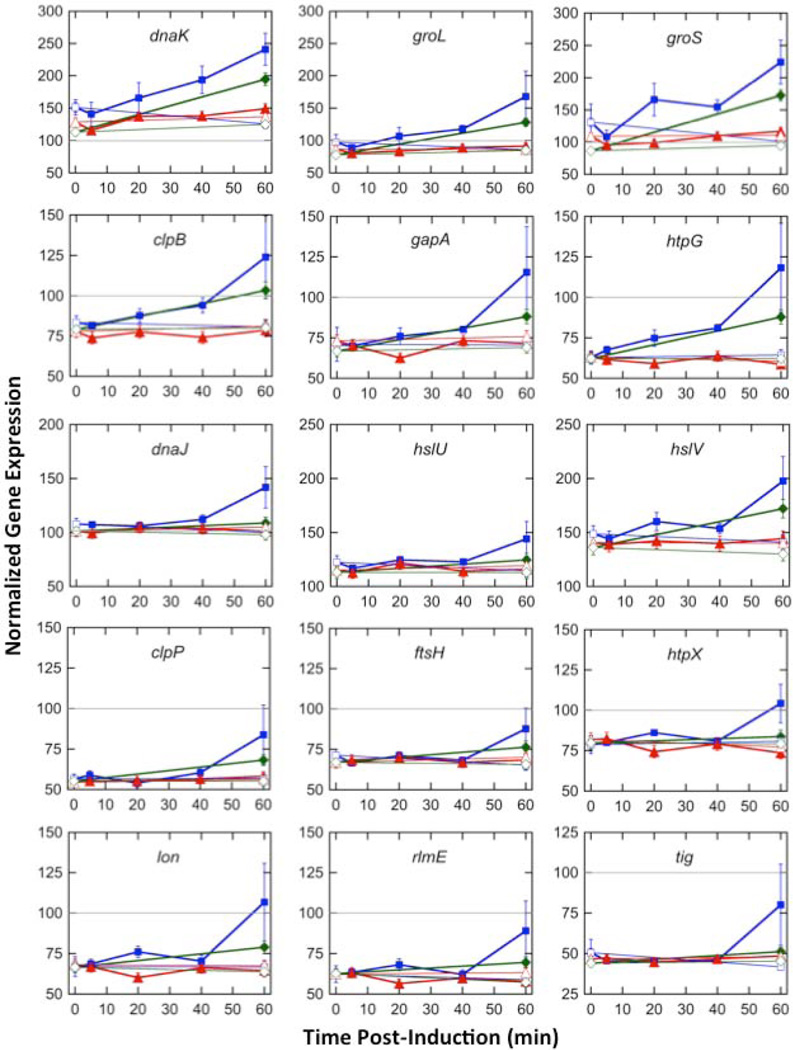 ,
), GFPCAT (,
), and ethanol-treated VP1GFP (,
); Uninduced (,
, )
and Induced (, ,
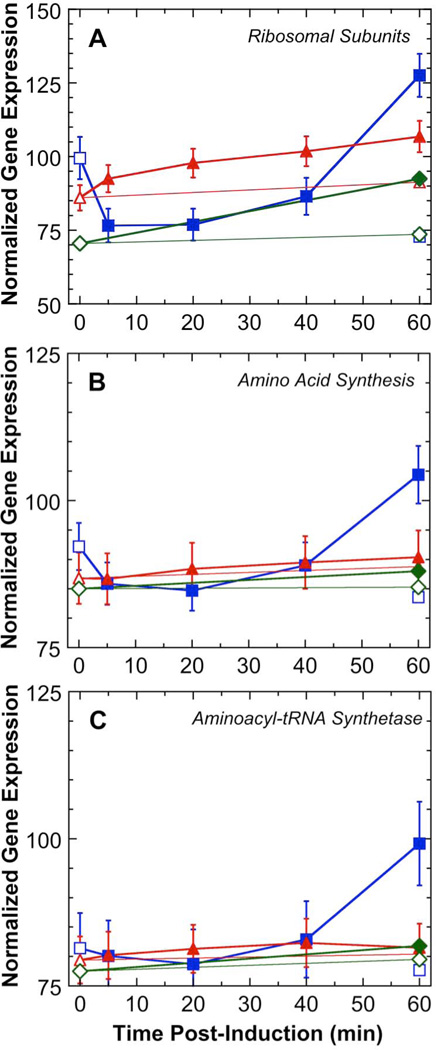
). Gene expression levels were normalized to
100, which represents the “average” gene expression intensity on
the DNA microarray. Standard error bars are shown.
,
), GFPCAT (,
), and ethanol-treated VP1GFP (,
); Uninduced (,
, )
and Induced (, ,
). Gene expression levels were normalized to
100, which represents the “average” gene expression intensity on
the DNA microarray. Standard error bars are shown.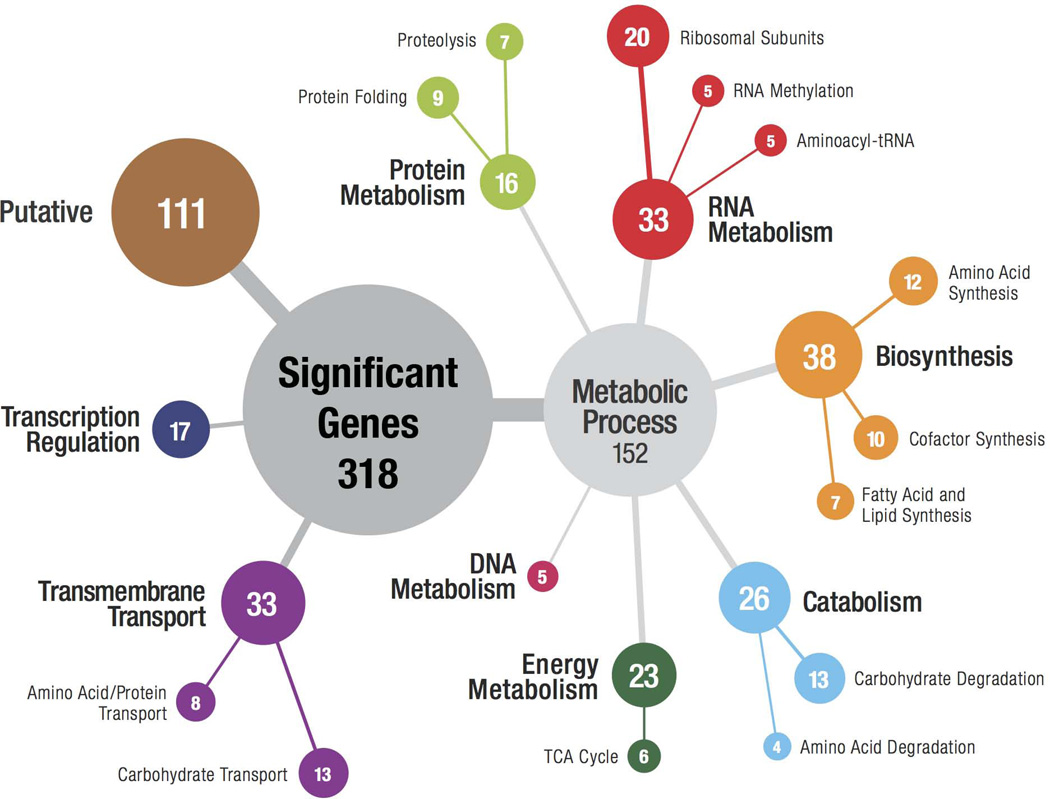
 ,
), GFPCAT (,
), and ethanol-treated VP1GFP (,
); Uninduced (,
, )
and Induced (, ,
). Gene expression levels were normalized to
100, which represents the “average” gene expression intensity on
the DNA microarray. Standard error bars are shown.
,
), GFPCAT (,
), and ethanol-treated VP1GFP (,
); Uninduced (,
, )
and Induced (, ,
). Gene expression levels were normalized to
100, which represents the “average” gene expression intensity on
the DNA microarray. Standard error bars are shown.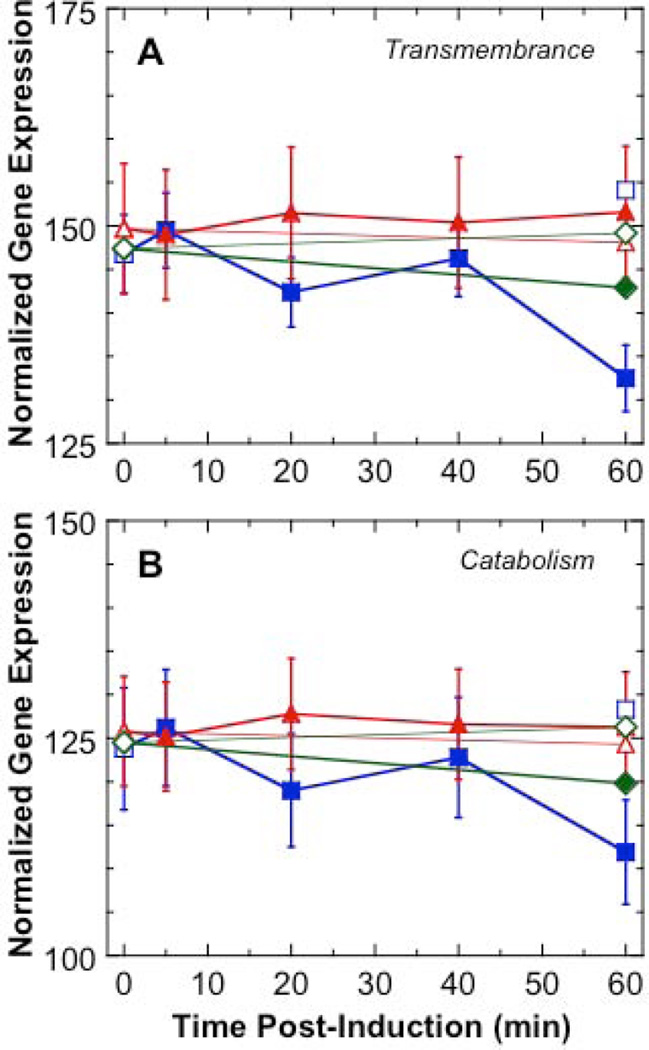 , ),
GFPCAT (, ),
and ethanol-treated VP1GFP (,
); Uninduced (,
, )
and Induced (, ,
). Gene expression levels were normalized to
100, which represents the “average” gene expression intensity on
the DNA microarray. Standard error bars are shown.
, ),
GFPCAT (, ),
and ethanol-treated VP1GFP (,
); Uninduced (,
, )
and Induced (, ,
). Gene expression levels were normalized to
100, which represents the “average” gene expression intensity on
the DNA microarray. Standard error bars are shown.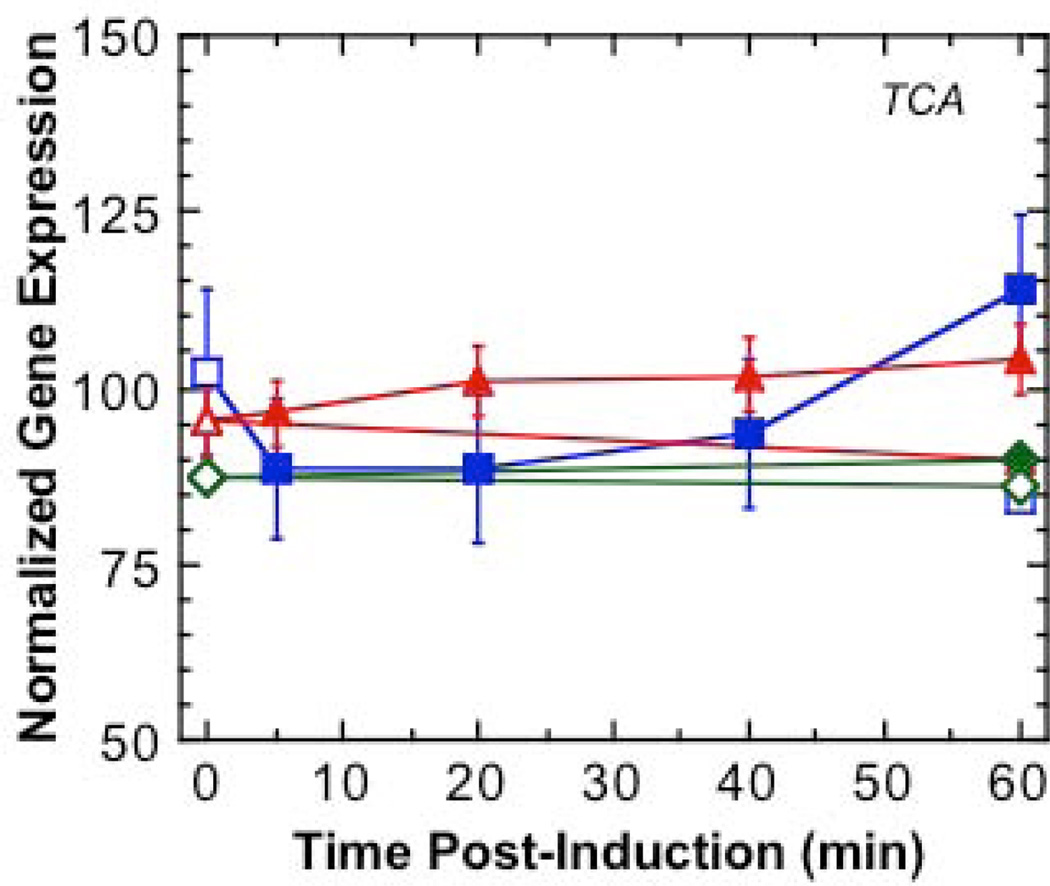 ,
), GFPCAT (,
), and ethanol-treated VP1GFP (,
); Uninduced (,
, )
and Induced (, ,
). Gene expression levels were normalized to
100, which represents the “average” gene expression intensity on
the DNA microarray. Standard error bars are shown.
,
), GFPCAT (,
), and ethanol-treated VP1GFP (,
); Uninduced (,
, )
and Induced (, ,
). Gene expression levels were normalized to
100, which represents the “average” gene expression intensity on
the DNA microarray. Standard error bars are shown.References
-
- Agostini F, Vendruscolo M, Tartaglia GG. Sequence-Based Prediction of Protein Solubility. Journal of Molecular Biology. 2012;421(2–3):237–241. - PubMed
-
- Baneyx F. Recombinant protein expression in Escherichia coli. Current Opinion in Biotechnology. 1999;10(5):411–421. - PubMed
-
- Baneyx F, Mujacic M. Recombinant protein folding and misfolding in Escherichia coli. Nature Biotechnology. 2004;22(11):1399–1408. - PubMed
-
- Basu A, Li X, Leong SSJ. Refolding of proteins from inclusion bodies: rational design and recipes. Applied Microbiology and Biotechnology. 2011;92(2):241–251. - PubMed
Publication types
MeSH terms
Substances
Grants and funding
LinkOut - more resources
Full Text Sources
Other Literature Sources
Molecular Biology Databases
Research Materials
