

T2 * MR relaxometry and ligament volume are associated with the structural properties of the healing ACL
- PMID: 24338640
- PMCID: PMC3946219
- DOI: 10.1002/jor.22563
T2 * MR relaxometry and ligament volume are associated with the structural properties of the healing ACL
Abstract
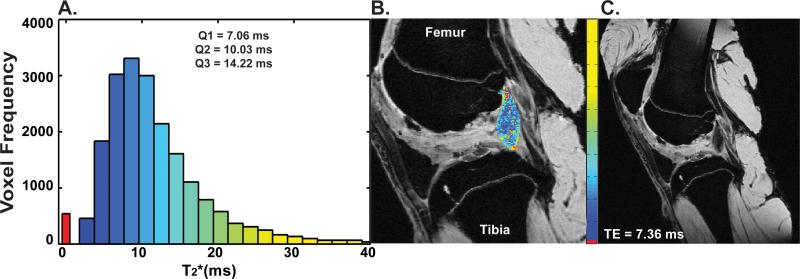
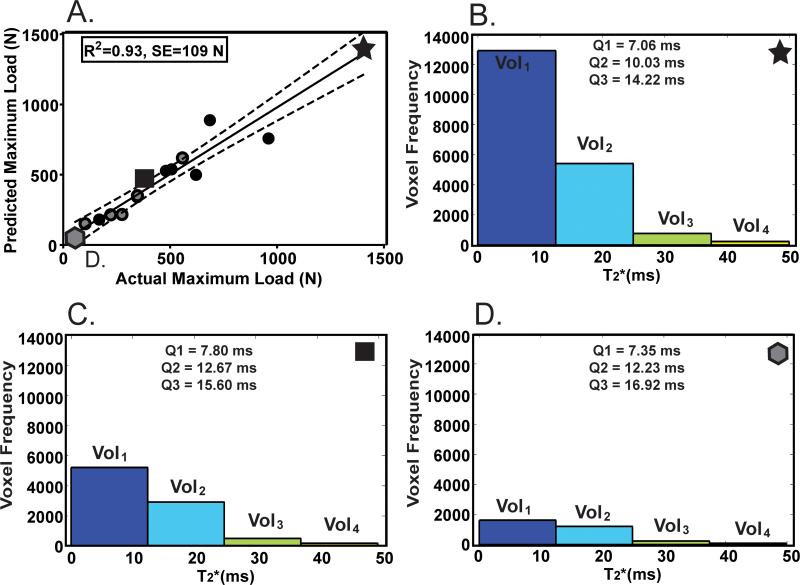
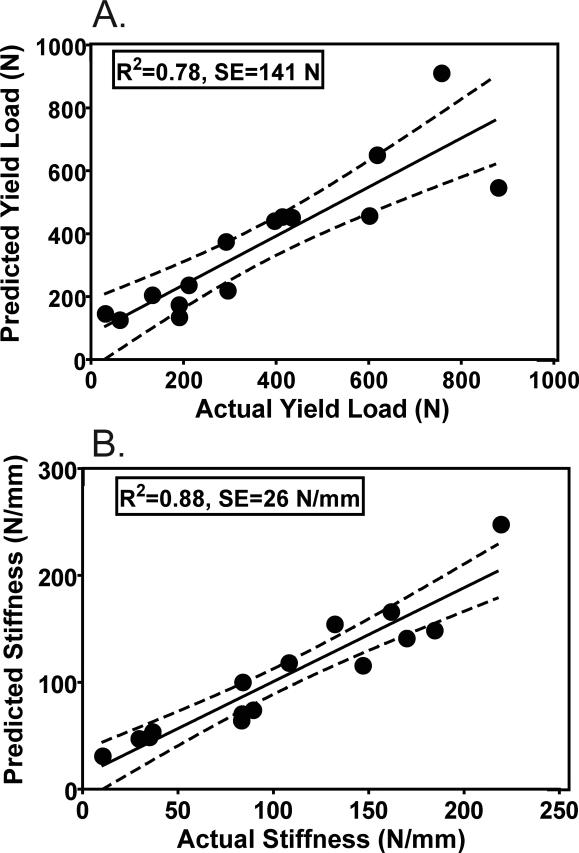
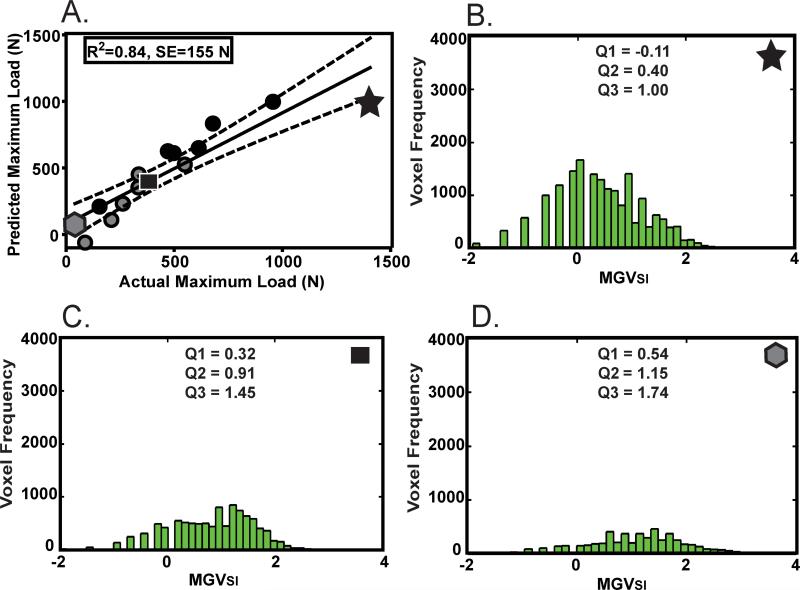
Our objective was to develop a non-invasive magnetic resonance (MR) method to predict the structural properties of a healing anterior cruciate ligament (ACL) using volume and T2 * relaxation time. We also compared our T2 *-based structural property prediction model to a previous model utilizing signal intensity, an acquisition-dependent variable. Surgical ACL transection followed by no treatment (i.e., natural healing) or bio-enhanced ACL repair was performed in a porcine model. After 52 weeks of healing, high-resolution MR images of the ACL tissue were collected. From these images, ligament volumes and T2 * maps were established. The structural properties of the ligaments were determined via tensile testing. Using the T2 * histogram profile, each ligament voxel was binned based on its T2 * value into four discrete tissue sub-volumes defined by specific T2 * intervals. The linear combination of the ligament sub-volumes binned by T2 * value significantly predicted maximum load, yield load, and linear stiffness (R(2) = 0.92, 0.82, 0.88; p < 0.001) and were similar to the previous signal intensity based method. In conclusion, the T2 * technique offers a highly predictive methodology that is a first step towards the development of a method that can be used to assess ligament healing across scanners, studies, and institutions.
Keywords: ACL; MRI; biomechanics; ligament healing; structural properties.
© 2013 Orthopaedic Research Society. Published by Wiley Periodicals, Inc.
Figures
References
-
- Hashemi J, Mansouri H, Chandrashekar N, et al. Age, sex, body anthropometry, and ACL size predict the structural properties of the human anterior cruciate ligament. J. Orthop. Res. 2011;29(7):993–1001. - PubMed
-
- Weiler A, Peters G, Mäurer J, et al. Biomechanical properties and vascularity of an anterior cruciate ligament graft can be predicted by contrast-enhanced magnetic resonance imaging. A two-year study in sheep. Am J Sports Med. 2001;29(6):751–761. - PubMed
-
- Chandrashekar N, Slauterbeck J, Hashemi J. Re: Sex-based differences in the anthropometric characteristics of the anterior cruciate ligament and its relation to intercondylar notch geometry: a cadaveric study. Am J Sports Med. 2009;37(2):423. - PubMed
-
- Noyes FR, Grood ES. The strength of the anterior cruciate ligament in humans and rhesus monkeys. J Bone Joint Surg Am. 1976;58(8):1074–1081. - PubMed
Publication types
MeSH terms
Grants and funding
LinkOut - more resources
Full Text Sources
Other Literature Sources
Medical
