. 2014 Feb 1;306(3):F309-20.
doi: 10.1152/ajprenal.00519.2013. Epub 2013 Dec 11.

ENaC activity is increased in isolated, split-open cortical collecting ducts from protein kinase Cα knockout mice

Affiliations

ENaC activity is increased in isolated, split-open cortical collecting ducts from protein kinase Cα knockout mice

Hui-Fang Bao et al. Am J Physiol Renal Physiol. .

Abstract

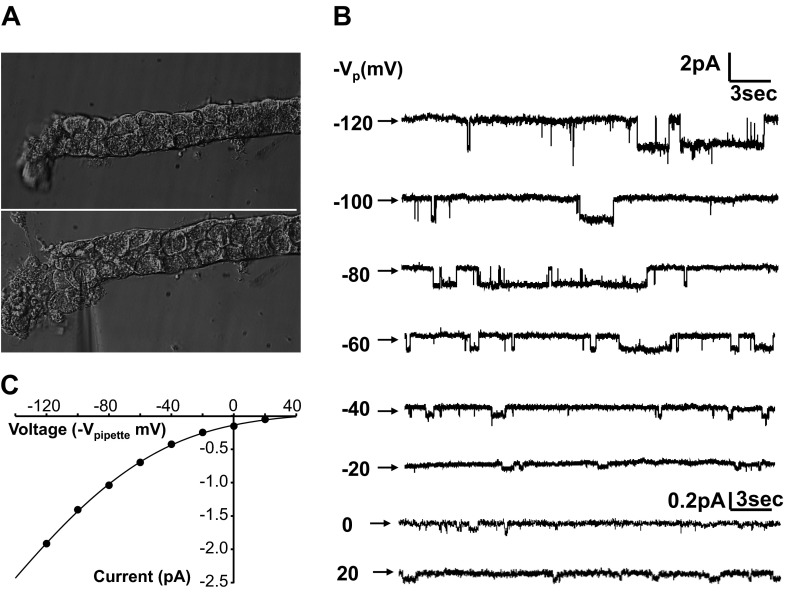
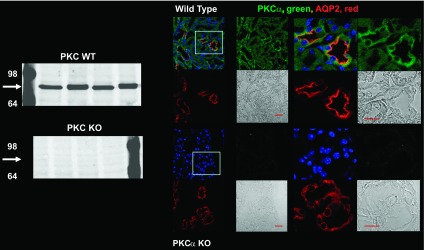
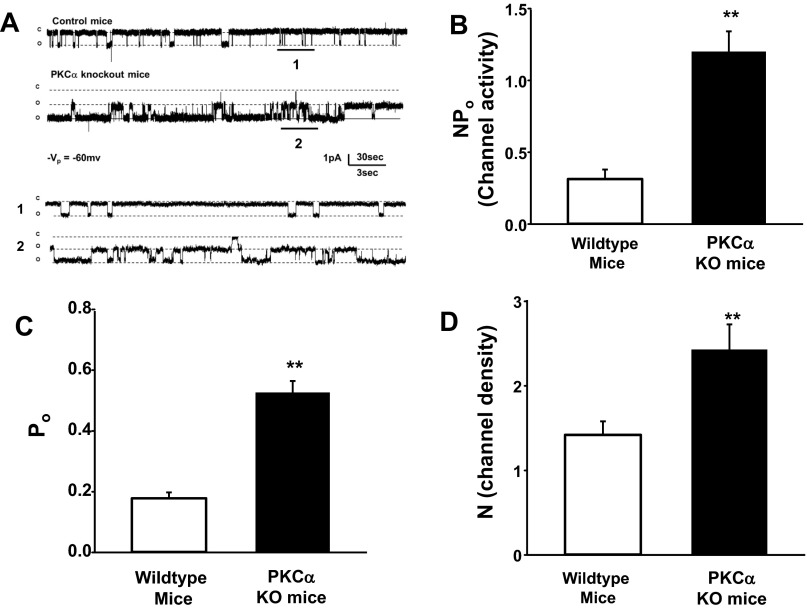
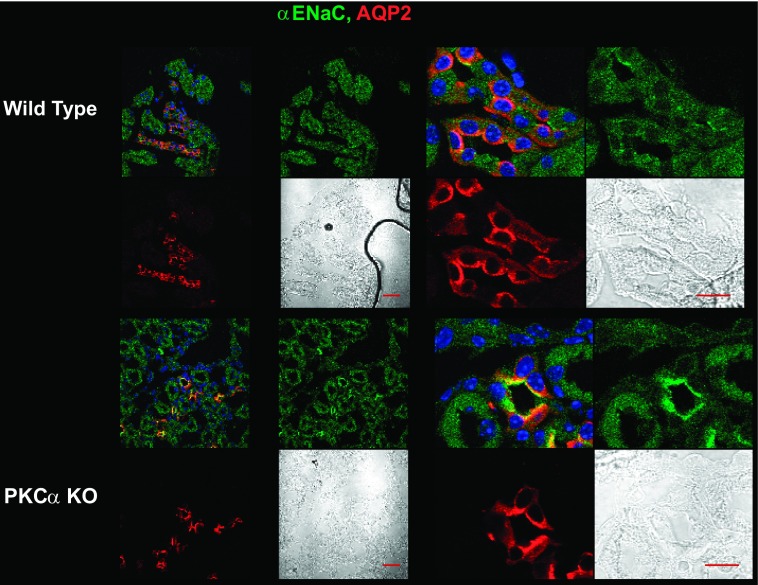
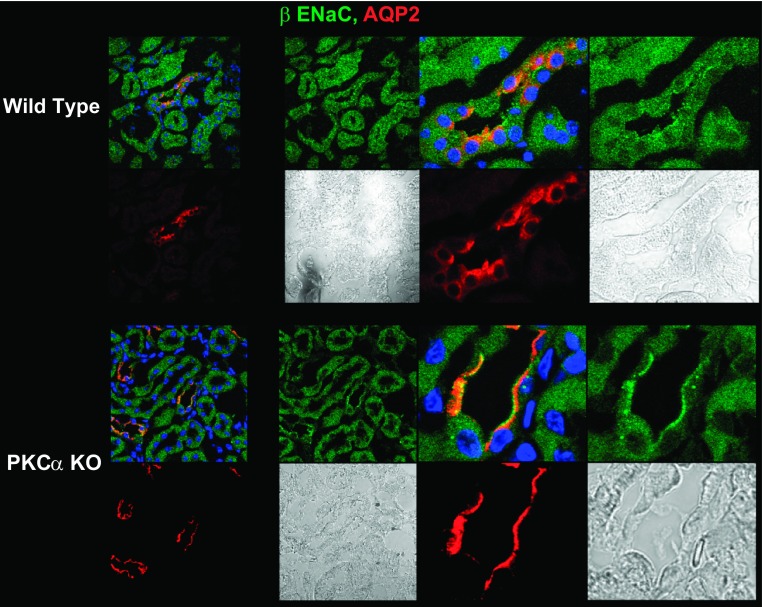
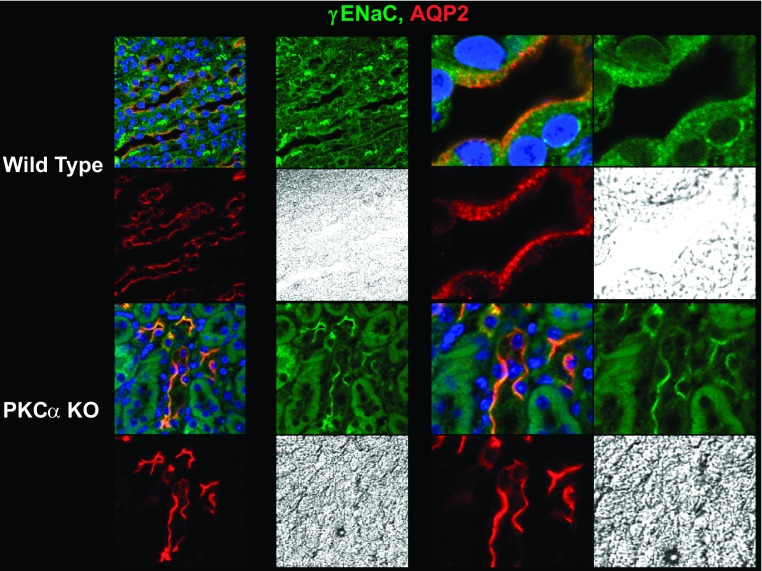
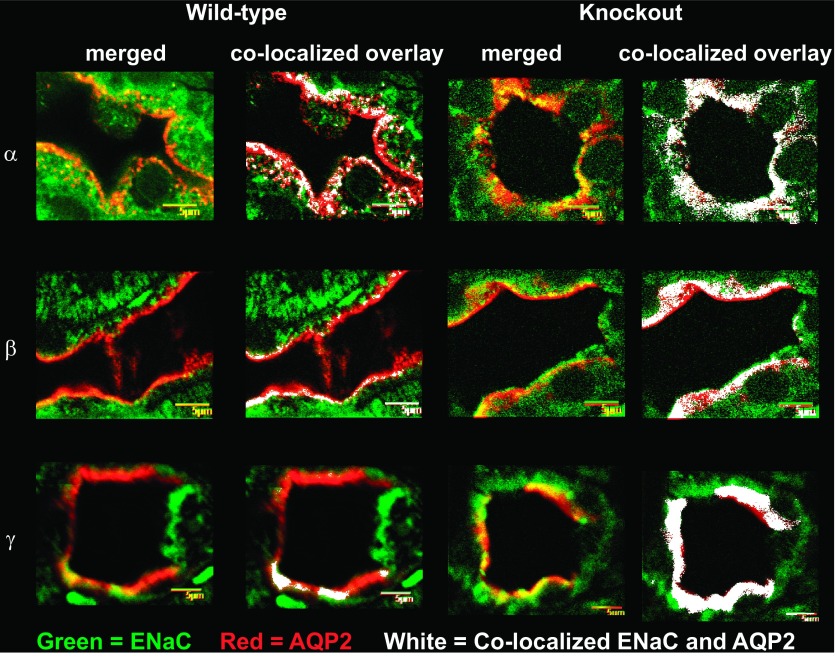
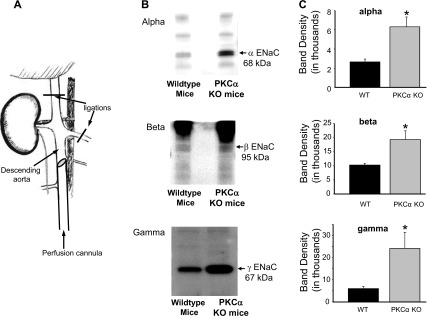
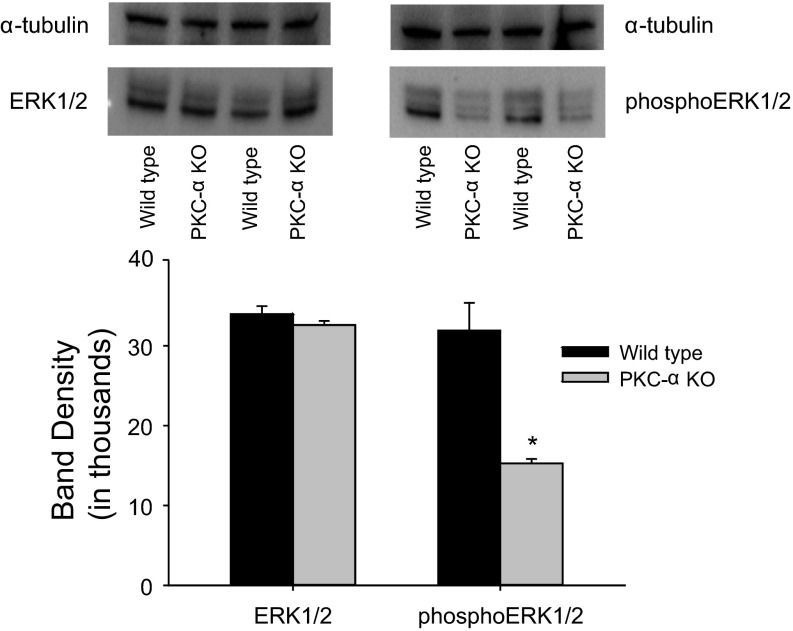
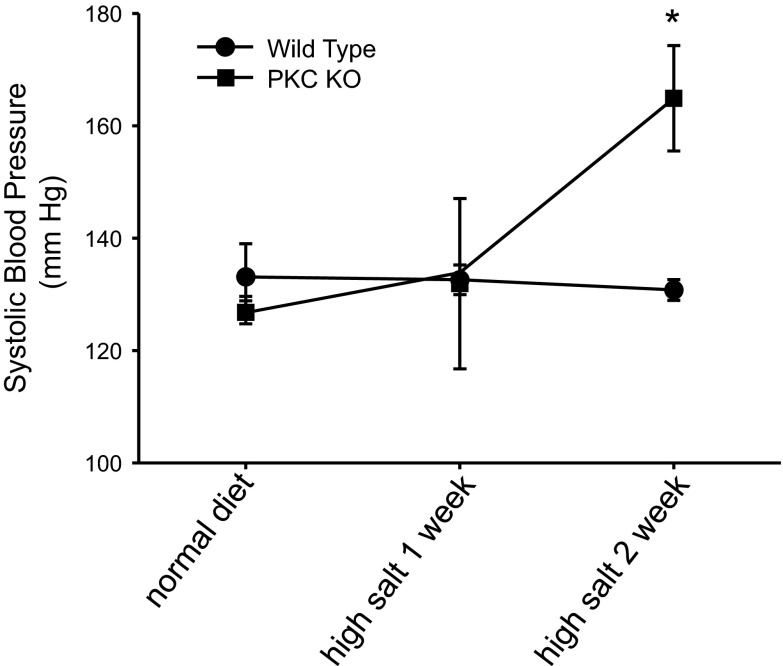
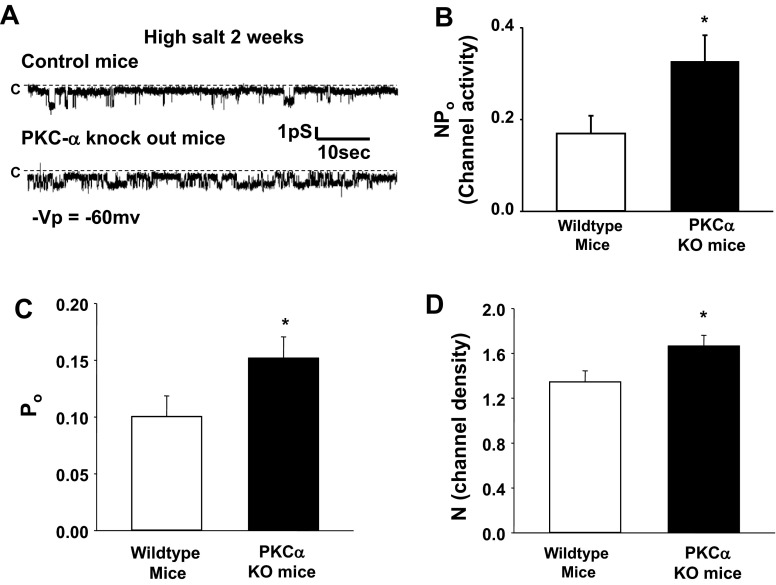
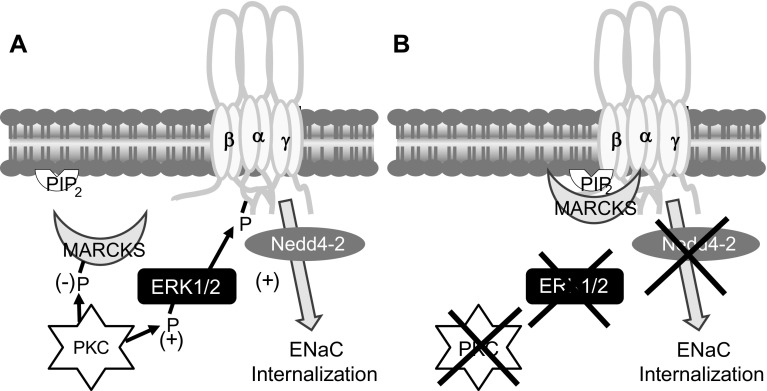
The epithelial Na channel (ENaC) is negatively regulated by protein kinase C (PKC) as shown using PKC activators in a cell culture model. To determine whether PKCα influences ENaC activity in vivo, we examined the regulation of ENaC in renal tubules from PKCα⁻/⁻ mice. Cortical collecting ducts were dissected and split open, and the exposed principal cells were subjected to cell-attached patch clamp. In the absence of PKCα, the open probability (P₀) of ENaC was increased three-fold vs. wild-type SV129 mice (0.52 ± 0.04 vs. 0.17 ± 0.02). The number of channels per patch was also increased. Using confocal microscopy, we observed an increase in membrane localization of α-, β-, and γ-subunits of ENaC in principal cells in the cortical collecting ducts of PKCα⁻/⁻ mice compared with wild-type mice. To confirm this increase, one kidney from each animal was perfused with biotin, and membrane protein was pulled down with streptavidin. The nonbiotinylated kidney was used to assess total protein. While total ENaC protein did not change in PKCα⁻/⁻ mice, membrane localization of all the ENaC subunits was increased. The increase in membrane ENaC could be explained by the observation that ERK1/2 phosphorylation was decreased in the knockout mice. These results imply a reduction in ENaC membrane accumulation and P₀ by PKCα in vivo. The PKC-mediated increase in ENaC activity was associated with an increase in blood pressure in knockout mice fed a high-salt diet.

Keywords: ENaC; hypertension; knockout mice; protein kinase Cα; renal tubules; single channels.


Figures

Fig. 1.
Fig. 1.
Channels in isolated, split-open tubules. A: an isolated tubule before (top) and after splitting open of one end of a tubule from a wild-type SV-129 mouse kidney. A patch electrode on a principal cell is visible in the bottom left of the image. Principal cells were identified by their characteristic morphology. B: single-channel records from the patch electrode on the cell in A. The currents are inward with long mean open and mean closed times characteristic of epithelial sodium channels (ENaC). Note that the vertical scale has been expanded 10-fold for the bottom 2 traces to more easily show the small unitary currents at these potentials. C: current-voltage relationship for the channel in B. The inward rectification and the very positive reversal potential are also characteristic of ENaC. The line through the data is the best nonlinear least-squares fit to the Goldman-Hodgkin-Katz equation and predicts that intracellular sodium is 12 ± 6.6 mM and principal cell sodium permeability is (6.4 ± 3.38) × 10−7cm/s. The conductance of the channel between −100 and 0 mV was 13.1 ± 1.43 pS, similar to that reported in rat connecting tubule by Frindt and Palmer (13).
Fig. 2.
Fig. 2.
PKCα knockout mice. Left: Western blots of renal cortical lysates from wild-type (WT) and PKCα knockout (KO) mice showing that the knockout mice have no PKCα. The expected molecular weight is 80–82 KDa. Twenty-five micrograms of lysate were loaded per well. Right: immunohistochemistry shows that SV-129 WT mice ubiquitously express PKCα in the kidney including in aquaporin-2 (AQP2; a marker for cortical collecting duct principal cells)-positive cells (top). The bottom panels show mice in which PKCα is globally knocked out. As expected, the KO mice have no detectable PKCα, and, in particular, have none in AQP2-positive principal cells. Scale bars (red lines) = 5 μm in all panels.
Fig. 3.
Fig. 3.
ENaC activity in PKCα KO mice. ENaC activity was recorded from cell-attached patches on principal cells (as in Fig. 1) from WT mice or PKCα KO mice. A: top 2 traces are long representative records from WT or KO cells (pipette potential is +60 mv). The activity of the KO cell is substantially increased above that of WT. The regions marked 1 and 2 in the top traces are expanded 10-fold in the bottom traces to emphasize the difference in the activity of WT and KO cells. All recordings were made at −60 mV (difference in potential between the inside of the cell and the patch pipette. If there is a significant basal membrane potential, it will add to the pipette potential). BD: summary of all single-channel data. The graph in B shows that ENaC activity [NPo; measured as the number of channels (N) times the open probability (Po)] increases over 3-fold in the PKCα KO mice compared with WT (P < 0.001). When the components of activity are examined individually, both Po (C) and N (D) increase significantly (P < 0.01). WT data are from 31 individual patches; KO data are from 21 individual patches. The patches were from 21 cortical collecting ducts isolated from WT and 18 cortical collecting ducts from PKCα KO. The cortical collecting ducts were obtained from 14 WT mice and 10 PKCα KO mice.
Fig. 4.
Fig. 4.
Membrane α-ENaC is increased in the principal cells of PKCα knockout mice. We prepared kidney slices from WT and KO before fixing and treating with AQP2 and α-ENaC antibodies. Subsequently, we used secondary antibodies that labeled AQP2 with a ds-Red monomer and α-ENaC with enhanced green fluorescent protein. Left: 4 panels are, from bottom right, differential interference contrast images, AQP2 in red, merged image, and α-ENaC in green. Right: expanded images from the areas outlined in white in the merged images on the left. α-ENaC appears to more strongly colocalize (yellow) with AQP2 in the principal cells from PKCα KO mice than in WT mice. Scale bars (red lines) = 5 μm in all panels.
Fig. 5.
Fig. 5.
Membrane β-ENaC is increased in the principal cells of PKCα KO mice. We prepared kidney slices from WT and KO before fixing and treating with AQP2 and β-ENaC antibodies. Subsequently, we used secondary antibodies that labeled AQP2 with a ds-Red monomer and β-ENaC with enhanced green fluorescent protein. Left: 4 panels are, from bottom right, differential interference contrast images, AQP2 in red, merged image, and β-ENaC in green. Right: expanded images from the areas outlined in white in the merged images on the left. β-ENaC appears to more strongly colocalize (yellow) with AQP2 in the principal cells from PKCα KO mice than in WT mice. Scale bars (red lines) = 5 μm in all panels.
Fig. 6.
Fig. 6.
Membrane γ-ENaC is increased in the principal cells of PKCα knockout mice. We prepared kidney slices from WT and KO before fixing and treating with AQP2 and γ-ENaC antibodies. Subsequently, we used secondary antibodies that labeled AQP2 with a ds-Red monomer and γ-ENaC with enhanced green fluorescent protein. Left: 4 panels are, from bottom right, differential interference contrast images, AQP2 in red, merged image, and γ-ENaC in green. Right: expanded images from the areas outlined in white in the merged images on the left. γ-ENaC appears to more strongly colocalize (yellow) with AQP2 in the principal cells from PKCα KO mice than in WT mice. Scale bars (red lines) = 5 μm in all panels.
Fig. 7.
Fig. 7.
ENaC subunits are in closer association with AQP2 in principal cells of KO animals than in WT animals. Kidney slices were stained with rabbit anti-ENaC subunit antibodies and goat anti-AQP2 antibody. Following treatment with appropriate fluorescent secondary antibodies, ENaC subunits (green) and AQP2 (red) were examined by confocal microscopy using an Olympus FV-1000 confocal microscope. The images in the 2 left columns are images from WT animals. The left image of the pair is a composite merged image of the red and green channels. From top to bottom are images for each of the 3 ENaC subunits. The yellow pixels in the composite image show the close association of an ENaC subunit with AQP2. The second column on the left is an image of the same slice as the merged image that was analyzed for colocalization of red and green pixels using a quantitative algorithm (colocalization threshold plugin in the ImageJ program; see methods). Pixels that have an intensity for both green and red above the green and red thresholds represent colocalization and are recolored in white. The other areas of the image represent a traditional merge of the green and red channels. Yellow areas may represent additional colocalization, but the intensities in the red and green channels are lower than the white highlighted pixels. Two right columns are the merged image and colocalized image for each of the 3 ENaC subunits for KO mice, respectively. There are significantly more white pixels in slices from KO animals than in WT animals (P < 0.001 by z-test; see Table1). Scale bars = 5 μm in all panels.
Fig. 8.
Fig. 8.
In situ biotinylation of mouse kidney. A: schematic of the method. Mice were anesthetized by injection of 80–90 mg/kg pentobarbital sodium (ip). The abdominal cavity was opened to the diaphragm, and a butterfly needle was inserted into the abdominal aorta at the bifurcation of the iliac arteries. The aorta was tied above the level of the renal arteries, and the left renal vein was cut to allow exit of the perfusate. Both kidneys were perfused with PBS for 5 min, after which the left renal artery and vein were tied and the left kidney was removed to serve as a nonbiotinylated control. The right renal vein was then cut, and the right kidney perfused with PBS containing 0.5 mg/ml sulfosuccinimidyl-2-[biotinamido]ethyl-1,3-dithiopropionate (Pierce) for 5 min, after which a biotin-quenching solution was perfused for 25 min to remove excess biotin. B: biotinylated ENaC subunits. Whole kidneys were homogenized, and protein was extracted. A membrane fraction was equally loaded on streptavidin beads and incubated overnight. After washing, protein was eluted with sample buffer and resolved on gels and detected with ENaC-specific antibodies. The amount of each of the subunits was greater in the PKCα KO mice than WT. C: quantification of the amounts of ENaC subunits. Mean densitometric analysis is shown of 3 typical experiments for each subunit. We used ImageJ to quantify the blots. The program calculated the cumulative sum of the pixel values above the background for specific bands. Asterisks indicate significant differences in KO density compared with wild-type (by t-test: α-ENaC: P = 0.026; β-ENaC: P = 0.046; by rank sum test: γ-ENaC: P = 0.029).
Fig. 9.
Fig. 9.
Active ERK is reduced in PKCα KO mice. We measured total ERK1/2 and phosphoERK in kidney lysates (each lane represents a separate animal). We used ImageJ to quantify the blots using a area that included both ERK1 and ERK2 bands. The program calculated the cumulative sum of the pixel values above the background for specific bands. The mean values of the densitometry results from 3 separate experiments show that total ERK is the same (t-test, P = 0.59), but phosphoERK is significantly reduced in KO compared with WT mice (t test, P < 0.001).
Fig. 10.
Fig. 10.
Blood pressure is increased in PKCα knockout mice. When blood pressure was measured by tail cuff (as described in methods), WT mice challenged with a high-salt diet (8% NaCl) had little if any change in systolic blood pressure, while blood pressure in KO mice increased significantly (marked with asterisk; n = 4/group). P < 0.001 for week 2 on a high-salt for KO vs. WT by 2-way ANOVA.
Fig. 11.
Fig. 11.
ENaC activity from tubules in high-salt diet mice. ENaC activity was recorded from cell-attached patches on principal cells (as in Figs. 1 and 3) from WT mice or PKCα KO mice. A: top trace is a representative record from WT, and bottom trace from a KO cell. The activity of the KO cell is substantially increased above that of the WT. All recordings were made at −60 mV (difference in potential between the inside of the cell and the patch pipette. If there is a significant basal membrane potential, it will add to the pipette potential). BD: summary of all single-channel data The graph in B shows that ENaC NPo [measured as the number of channels (N) times the Po] increases ∼50% in the PKCα KO mice compared with WT (P = 0.033). When the components of activity are examined individually, both Po (C) and N (D) increase significantly (P < 0.03). WT data are from 33 individual patches; KO data are from 42 individual patches. The patches were from 11 cortical collecting ducts isolated from WT and 15 cortical collecting ducts from PKCα KO. The cortical collecting ducts were obtained from 4 WT mice and 4 PKCα KO mice.
Fig. 12.
Fig. 12.
Schematic diagram of PKC signaling in WT and KO mice. A: situation in WT mice. PKCα is active and phosphorylates myristoylated alanine-rich C-kinase substrate (MARCKS) protein. When phosphorylated, MARCKS leaves the membrane and does not sequester and present phosphatidylinositol 4,5-bisphosphate (PIP2) to ENaC, causing a decrease in ENaC Po. Active PKC also phosphorylates ERK, which in turn phosphorylates ENaC. ERK phosphorylation of ENaC promotes Nedd4-2 interaction with and ubiquitination of ENaC, with subsequent internalization. This reduces the apical density of ENaC. B: situation in PKCα KO mice. PKC is absent, and MARCKS protein is not phosphorylated. Therefore, MARCKS remains associated with the membrane and presents PIP2 to ENaC to increase ENaC Po. ERK is also not phosphorylated so that ENaC internalization is reduced and apical membrane ENaC is increased.

Comment in

  • PC and PKC: in vivo vs. in vitro.
    Staruschenko A, Safonova TA. Staruschenko A, et al. Am J Physiol Renal Physiol. 2014 Mar 1;306(5):F507-8. doi: 10.1152/ajprenal.00678.2013. Epub 2013 Dec 26. Am J Physiol Renal Physiol. 2014. PMID: 24370588 Free PMC article. No abstract available.

Similar articles

Cited by

References

    1. Alli AA, Bao HF, Alli AA, Aldrugh Y, Song JZ, Ma HP, Yu L, Al-Khalili O, Eaton DC. Phosphatidylinositol phosphate-dependent regulation of Xenopus ENaC by MARCKS protein. Am J Physiol Renal Physiol 303: F800–F811, 2012 - PMC - PubMed
    1. Alli AA, Gower WR., Jr The C type natriuretic peptide receptor tethers AHNAK1 at the plasma membrane to potentiate arachidonic acid-induced calcium mobilization. Am J Physiol Cell Physiol 297: C1157–C1167, 2009 - PubMed
    1. Alli AA, Gower WR., Jr Molecular approaches to examine the phosphorylation state of the C type natriuretic peptide receptor. J Cell Biochem 110: 985–994, 2010 - PubMed
    1. Alli AA, Song JZ, Al-Khalili O, Bao HF, Ma HP, Alli AA, Eaton DC. Cathepsin B is secreted apically from Xenopus 2F3 cells and cleaves the epithelial sodium channel (ENaC) to increase its activity. J Biol Chem 287: 30073–30083, 2012 - PMC - PubMed
    1. Awayda MS, Ismailov II, Berdiev BK, Fuller CM, Benos DJ. Protein kinase regulation of a cloned epithelial Na+ channel. J Gen Physiol 108: 49–65, 1996 - PMC - PubMed

Publication types

MeSH terms

LinkOut - more resources