Randomized Controlled Trial
. 2014 Dec;72(6):1530-40.
doi: 10.1002/mrm.25055. Epub 2013 Dec 12.

Whole-brain three-dimensional T2-weighted BOLD functional magnetic resonance imaging at 7 Tesla

Affiliations
Randomized Controlled Trial

Whole-brain three-dimensional T2-weighted BOLD functional magnetic resonance imaging at 7 Tesla

Jun Hua et al. Magn Reson Med. 2014 Dec.

Abstract

Purpose: A new acquisition scheme for T2-weighted spin-echo BOLD fMRI is introduced.

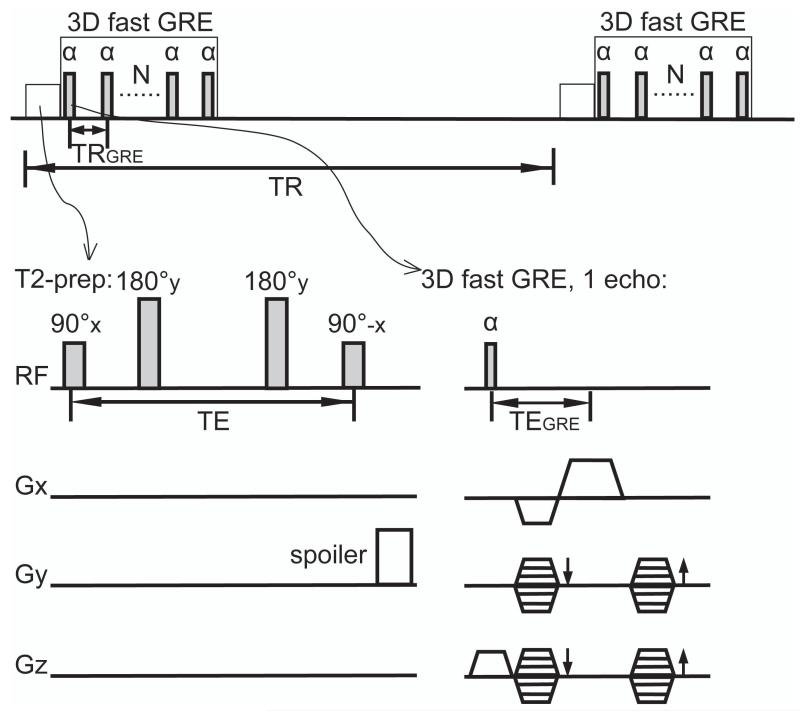
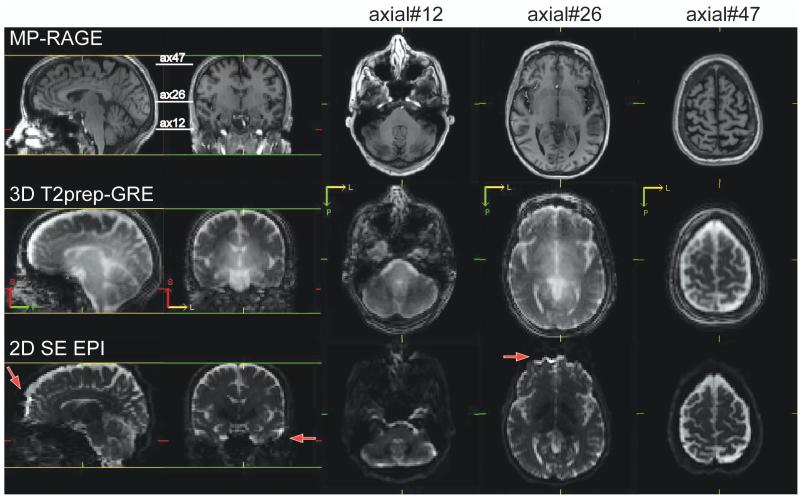
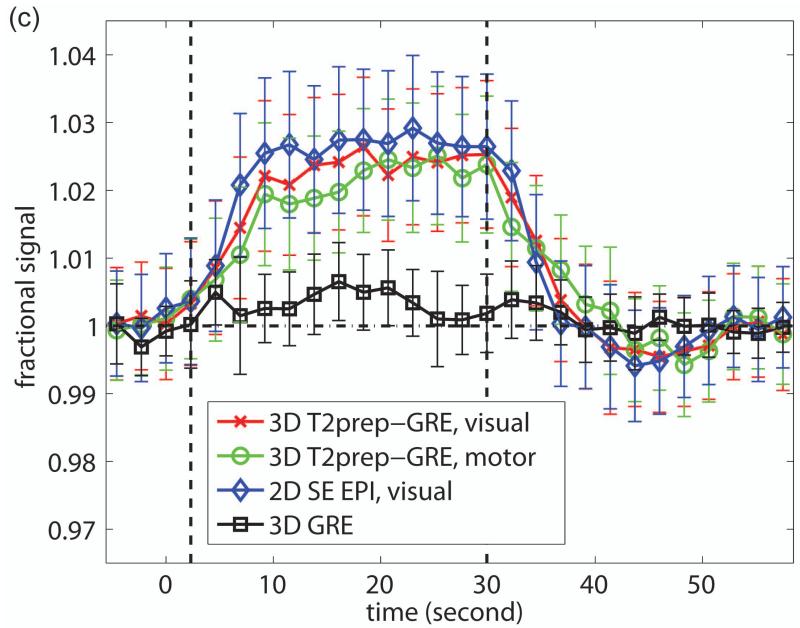
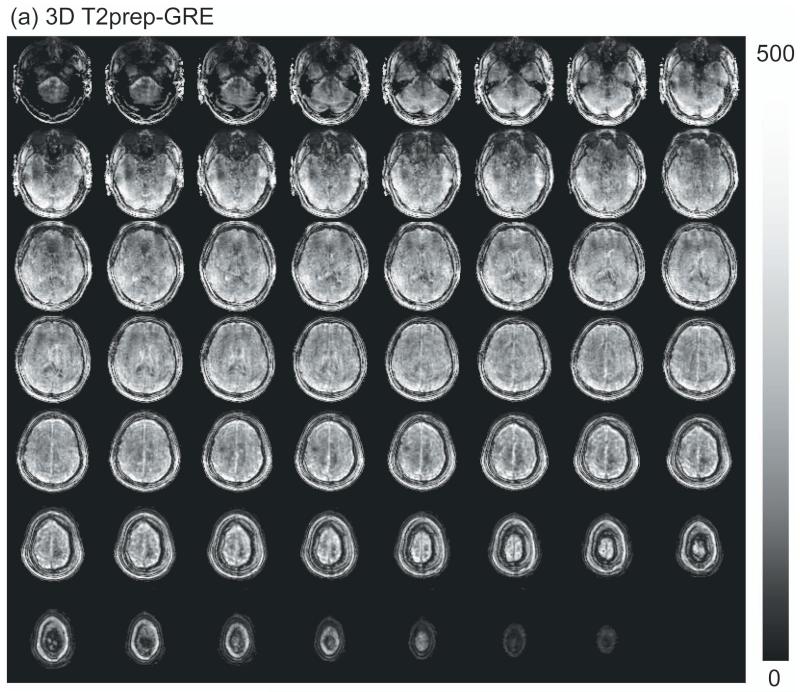
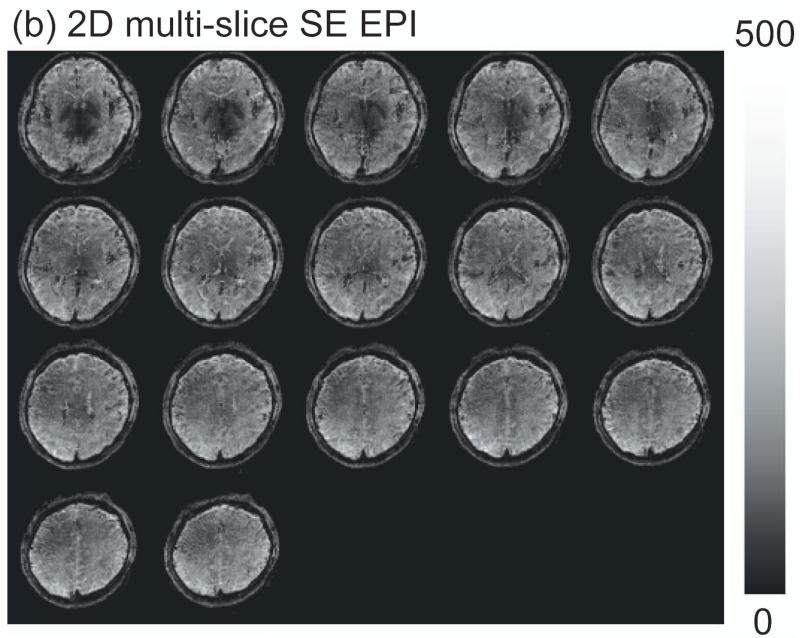
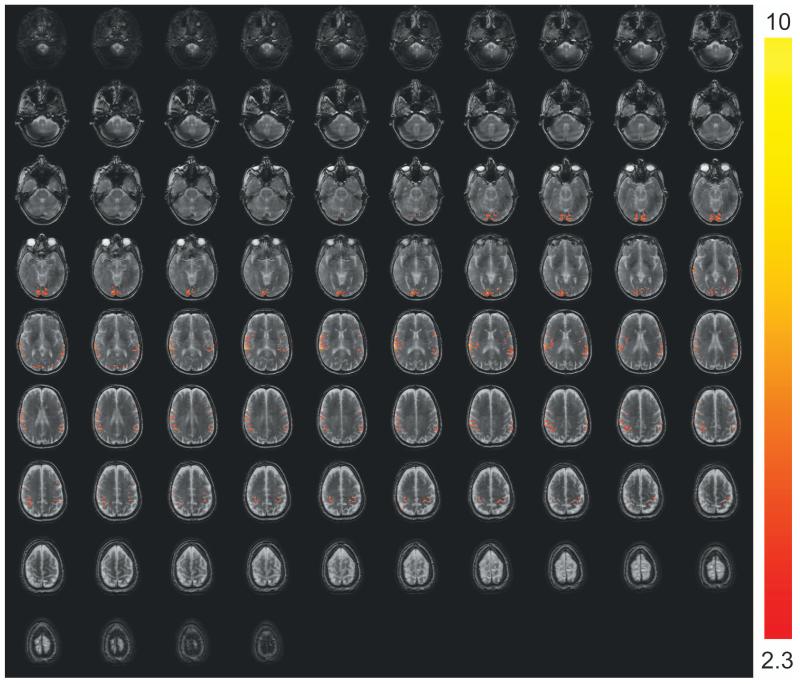
Methods: It uses a T2-preparation module to induce blood-oxygenation-level-dependent (BOLD) contrast, followed by a single-shot three-dimensional (3D) fast gradient-echo readout with short echo time (TE). It differs from most spin-echo BOLD sequences in that BOLD contrast is generated before the readout, which eliminates the "dead time" due to long TE required for T2 contrast, and substantially improves acquisition efficiency. This approach, termed "3D T2prep-GRE," was implemented at 7 Tesla (T) with a typical spatial (2.5 × 2.5 × 2.5 mm(3) ) and temporal (TR = 2.3 s) resolution for functional MRI (fMRI) and whole-brain coverage (55 slices), and compared with the widely used 2D spin-echo EPI sequence.

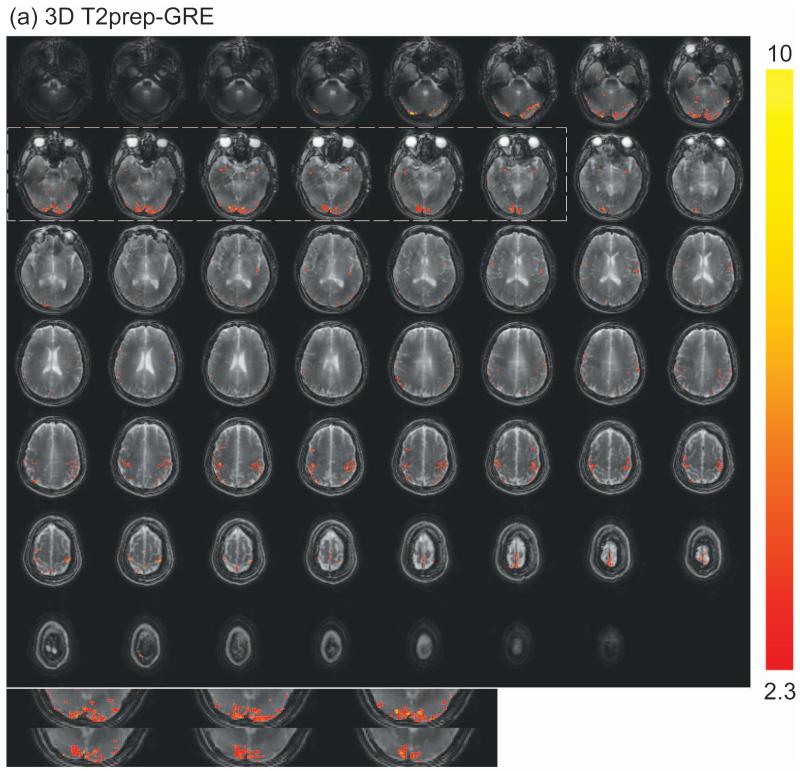
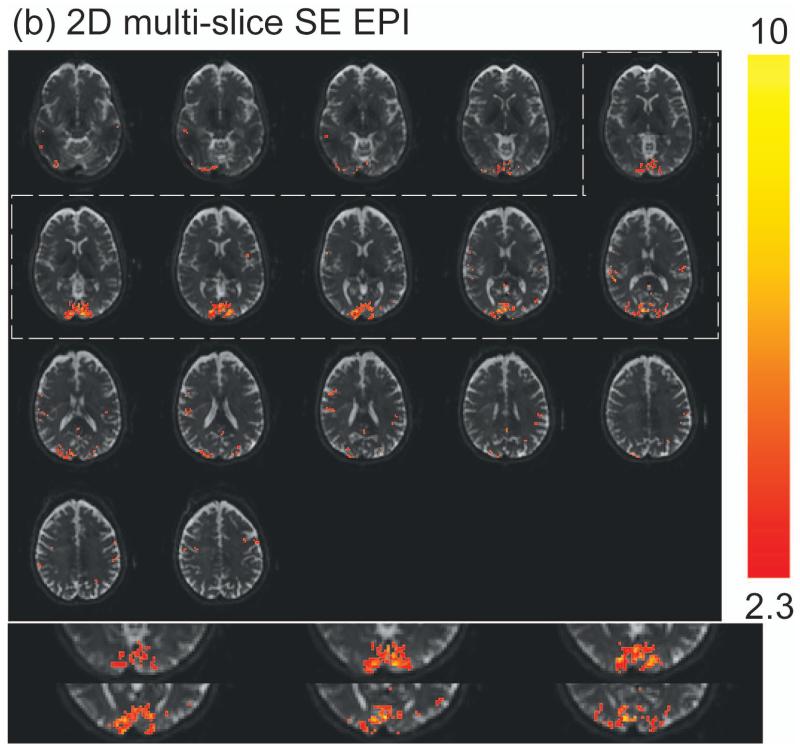
Results: In fMRI experiments of simultaneous visual/motor activities, 3D T2prep-GRE showed minimal distortion and little signal dropout across the whole brain. Its lower power deposition allowed greater spatial coverage (55 versus 17 slices with identical TR, resolution and power level), temporal SNR (60% higher) and CNR (35% higher) efficiency than 2D spin-echo EPI. It also showed smaller T2* contamination.

Conclusion: This approach is expected to be useful for ultra-high field fMRI, especially for regions near air cavities. The concept of using T2-preparation to generate BOLD contrast can be combined with many other sequences at any field strength.

Keywords: GRE; SE BOLD; T2 preparation; TFE; blood-oxygenation-level-dependent; fast gradient echo; high field; turbo field echo.


Figures

Figure 1
Figure 1
Pulse sequence of 3D T2prep-GRE. A T2 preparation module (90°x-180°y-180°y-90°-x, spatially non-selective; hyperbolic secant adiabatic pulses were used for 180° pulses) was applied immediately before the readout. Two 180° pulses were used in T2 preparation to compensate phase variations and to suppress inflow effect. A spoiler gradient was played at the end of T2 preparation on the first phase encoding axis that has the lowest gradient duty cycle to dephase any residual transverse magnetization. A single shot 3D fast GRE readout with low-high (centric) phase encoding was used. TRGRE: time period between two consecutive echoes during the fast GRE readout; TEGRE: echo time for one echo in 3D fast GRE; TR: time period between two consecutive 3D fast GRE readout; TE: duration of T2 preparation excluding the spoiler at the end.
Figure 2
Figure 2
Comparison of image quality for MPRAGE (anatomical, voxel=1×1×2.5mm3, 55 slices, reconstructed from the original 1mm isotropic scan), 3D T2prep-GRE fMRI scan (TR=2.3s, 2.5mm isotropic voxel, 55 slices) and 2D multi-slice SE EPI (TR=9s, 2.5mm isotropic voxel, 55 slices, no functional stimulation). Due to SAR limits, 2D SE EPI has to use a TR 4 times longer than 3D T2prep-GRE to acquire the same number of slices covering the whole brain. Sagittal, coronal and 3 axial slices at different locations (slice number 12, 26 and 47) are shown. Geometric distortion is visible in SE EPI images, especially in the frontal and temporal lobes (red arrows). 3D T2prep-GRE images show minimal distortion and dropouts. S: superior; P: posterior; L: left.
Figure 3
Figure 3
Representative fMRI results from one subject. (a) fMRI activation map with 3D T2prep-GRE (TR=2.3s, 2.5mm isotropic voxel, 55 slices). (b) fMRI activation map with 2D multi-slice SE EPI (TR=2.3s, 2.5mm isotropic voxel, 17 slices, angled to cover more cortex and to avoid orbitofrontal cortex). In both (a) and (b), voxels meeting activation criteria are highlighted with their t-scores (scale indicated on the right, threshold=2.3). No spatial smoothing was performed in the analysis. The visual cortex regions in T2prep-GRE and SE EPI images in the dashed boxes are zoomed in and displayed at the bottom of the panels. (c) Average time courses from voxels meeting activation criteria in visual (red, x-mark) and motor (green, open circle) cortex with 3D T2prep-GRE, and in visual cortex with 2D SE EPI (blue, diamond). In visual cortex, only common voxels activated in both scans were included. A separate fMRI scan was per-formed using the same 3D fast GRE readout without T2 preparation, and the average time course from this scan (black, square) was calculated over voxels activated in the previous 3D T2prep-GRE scan (both visual and motor cortex). Four blocks were averaged to one block. The two vertical dashed lines indicate the start and cessation of stimulus. The error bars represent inter-voxel standard deviations within subject, which are much larger than the inter-subject standard deviations reported in Table 2.
Figure 3
Figure 3
Representative fMRI results from one subject. (a) fMRI activation map with 3D T2prep-GRE (TR=2.3s, 2.5mm isotropic voxel, 55 slices). (b) fMRI activation map with 2D multi-slice SE EPI (TR=2.3s, 2.5mm isotropic voxel, 17 slices, angled to cover more cortex and to avoid orbitofrontal cortex). In both (a) and (b), voxels meeting activation criteria are highlighted with their t-scores (scale indicated on the right, threshold=2.3). No spatial smoothing was performed in the analysis. The visual cortex regions in T2prep-GRE and SE EPI images in the dashed boxes are zoomed in and displayed at the bottom of the panels. (c) Average time courses from voxels meeting activation criteria in visual (red, x-mark) and motor (green, open circle) cortex with 3D T2prep-GRE, and in visual cortex with 2D SE EPI (blue, diamond). In visual cortex, only common voxels activated in both scans were included. A separate fMRI scan was per-formed using the same 3D fast GRE readout without T2 preparation, and the average time course from this scan (black, square) was calculated over voxels activated in the previous 3D T2prep-GRE scan (both visual and motor cortex). Four blocks were averaged to one block. The two vertical dashed lines indicate the start and cessation of stimulus. The error bars represent inter-voxel standard deviations within subject, which are much larger than the inter-subject standard deviations reported in Table 2.
Figure 4
Figure 4
Representative temporal SNR (tSNR) efficiency maps from one subject. (a) 3D T2prep-GRE (TR=2.3s, 2.5mm isotropic voxel, 55 slices); (b) 2D SE EPI (TR=2.3s, 2.5mm isotropic voxel, 17 slices, angled to cover more cortex and to avoid orbitofrontal cortex).
Figure 4
Figure 4
Representative temporal SNR (tSNR) efficiency maps from one subject. (a) 3D T2prep-GRE (TR=2.3s, 2.5mm isotropic voxel, 55 slices); (b) 2D SE EPI (TR=2.3s, 2.5mm isotropic voxel, 17 slices, angled to cover more cortex and to avoid orbitofrontal cortex).
Figure 5
Figure 5
3D T2prep-GRE fMRI images and activation maps with TR=1860ms, voxel=1.5×1.5×1.6mm3 and 84 slices from one subject. Voxels meeting activation criteria are highlighted with their t-scores (scale indicated on the right, threshold=2.3).

References

    1. Yacoub E, Shmuel A, Pfeuffer J, Van De Moortele PF, Adriany G, Andersen P, Vaughan JT, Merkle H, Ugurbil K, Hu X. Imaging brain function in humans at 7 Tesla. Magn Reson Med. 2001;45(4):588–594. - PubMed
    1. Yacoub E, Duong TQ, Van De Moortele PF, Lindquist M, Adriany G, Kim SG, Ugurbil K, Hu X. Spin-echo fMRI in humans using high spatial resolutions and high magnetic fields. Magn Reson Med. 2003;49(4):655–664. - PubMed
    1. Uludag K, Muller-Bierl B, Ugurbil K. An integrative model for neuronal activity-induced signal changes for gradient and spin echo functional imaging. Neuroimage. 2009;48(1):150–165. - PubMed
    1. Ogawa S, Menon RS, Tank DW, Kim SG, Merkle H, Ellermann JM, Ugurbil K. Functional brain mapping by blood oxygenation level-dependent contrast magnetic resonance imaging. A comparison of signal characteristics with a biophysical model. Biophys J. 1993;64(3):803. - PMC - PubMed
    1. Boxerman JL, Hamberg LM, Rosen BR, Weisskoff RM. MR contrast due to intravascular magnetic susceptibility perturbations. Magn Reson Med. 1995;34(4):555. - PubMed

Publication types

MeSH terms