

Mapping in vivo tumor oxygenation within viable tumor by 19F-MRI and multispectral analysis
- PMID: 24339736
- PMCID: PMC3858898
- DOI: 10.1593/neo.131468
Mapping in vivo tumor oxygenation within viable tumor by 19F-MRI and multispectral analysis
Abstract
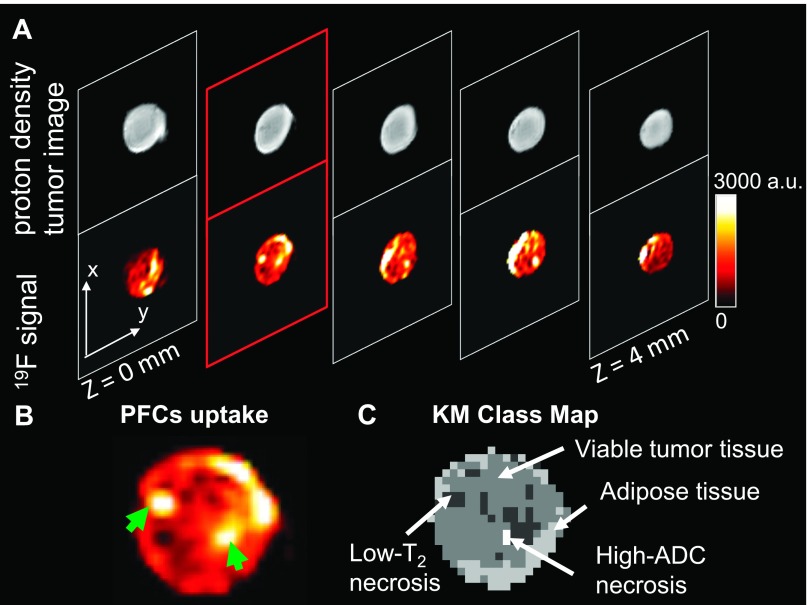
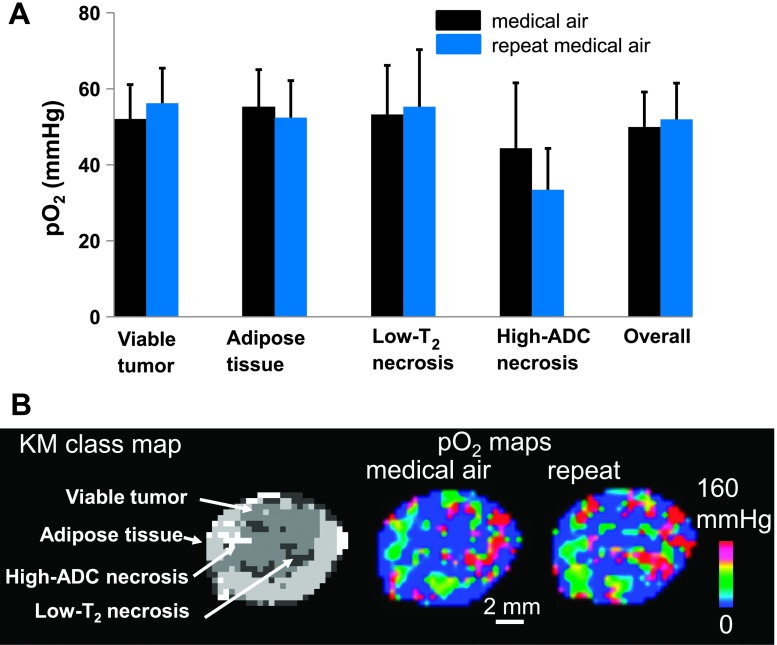
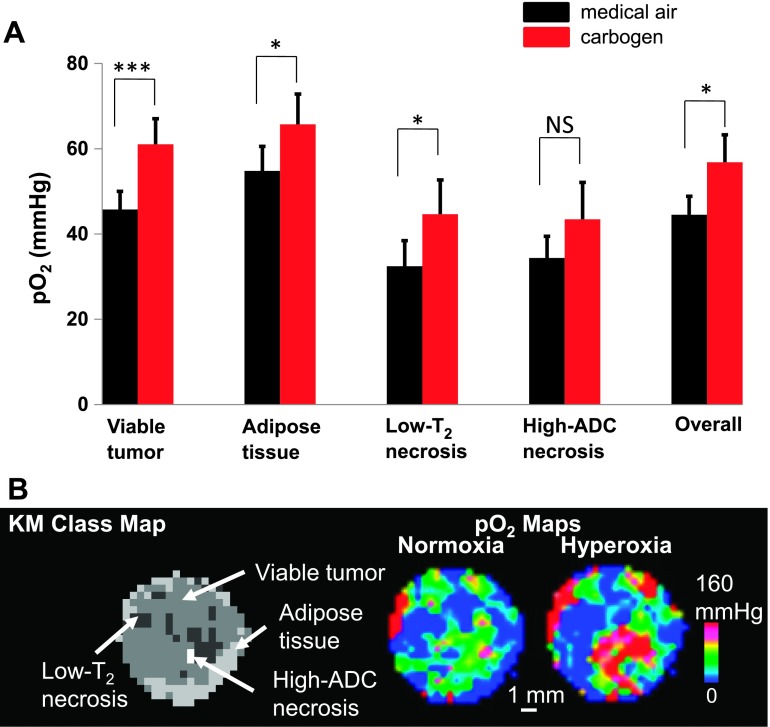
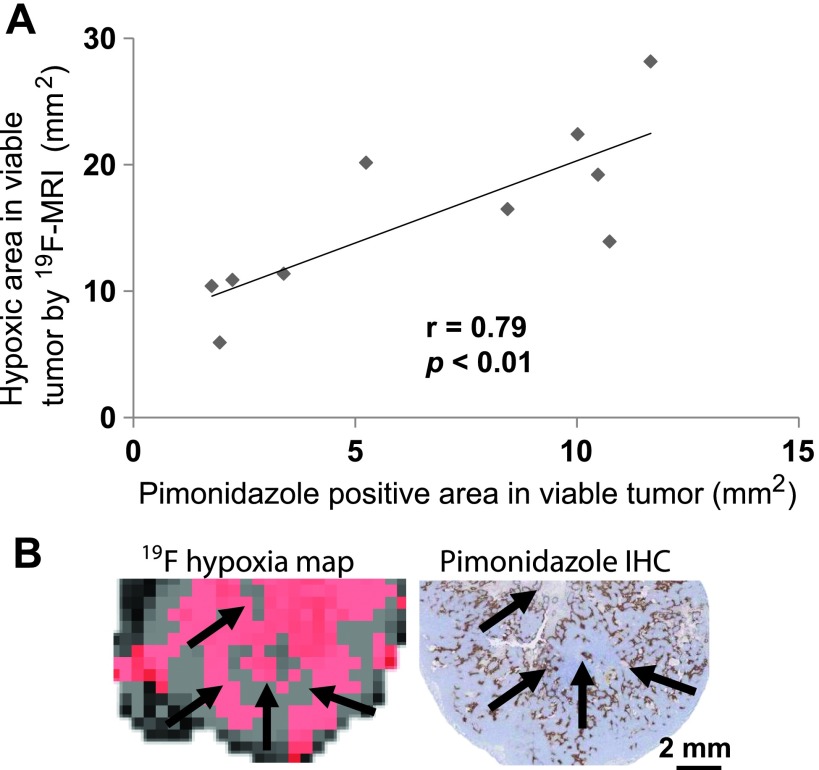
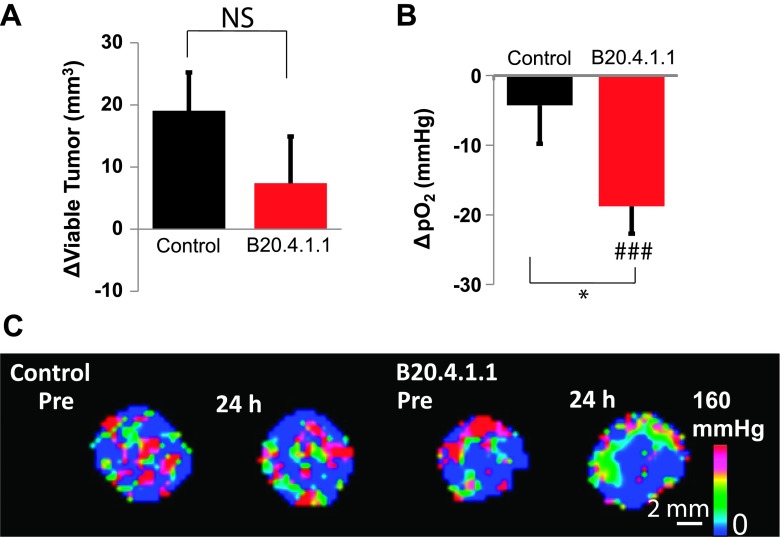
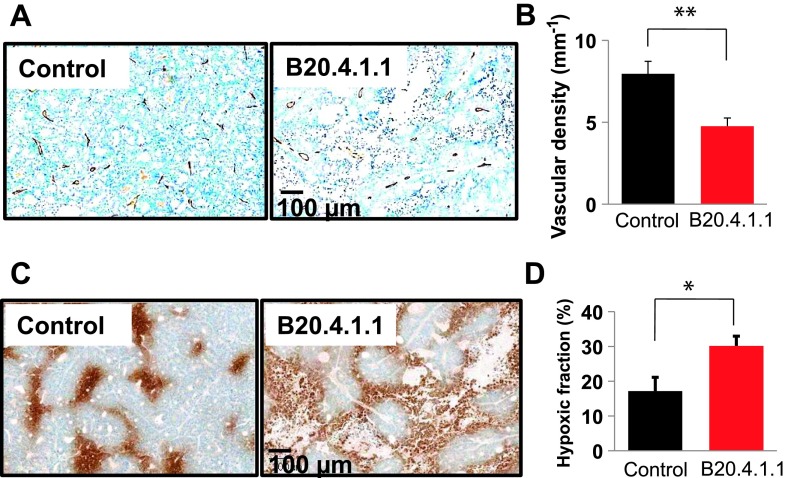
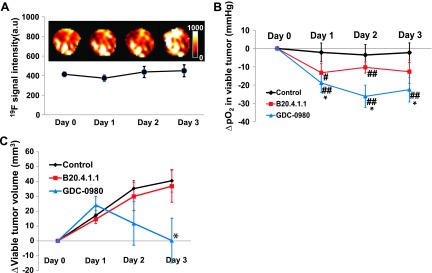
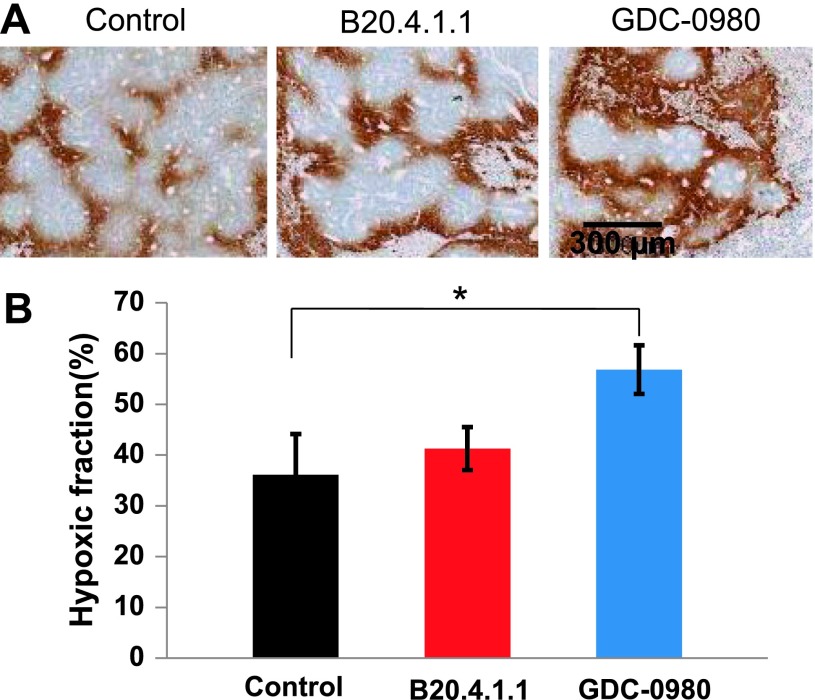
Quantifying oxygenation in viable tumor remains a major obstacle toward a better understanding of the tumor micro-environment and improving treatment strategies. Current techniques are often complicated by tumor heterogeneity. Herein, a novel in vivo approach that combines (19)F magnetic resonance imaging ((19)F-MRI) R 1 mapping with diffusion-based multispectral (MS) analysis is introduced. This approach restricts the partial pressure of oxygen (pO2) measurements to viable tumor, the tissue of therapeutic interest. The technique exhibited sufficient sensitivity to detect a breathing gas challenge in a xenograft tumor model, and the hypoxic region measured by MS (19)F-MRI was strongly correlated with histologic estimates of hypoxia. This approach was then applied to address the effects of antivascular agents on tumor oxygenation, which is a research question that is still under debate. The technique was used to monitor longitudinal pO2 changes in response to an antibody to vascular endothelial growth factor (B20.4.1.1) and a selective dual phosphoinositide 3-kinase/mammalian target of rapamycin inhibitor (GDC-0980). GDC-0980 reduced viable tumor pO2 during a 3-day treatment period, and a significant reduction was also produced by B20.4.1.1. Overall, this method provides an unprecedented view of viable tumor pO2 and contributes to a greater understanding of the effects of antivascular therapies on the tumor's microenvironment.
Figures
Similar articles
-
Multimodal microvascular imaging reveals that selective inhibition of class I PI3K is sufficient to induce an antivascular response.Neoplasia. 2013 Jul;15(7):694-711. doi: 10.1593/neo.13470. Neoplasia. 2013. PMID: 23814482 Free PMC article.
-
Monitoring and Targeting Anti-VEGF Induced Hypoxia within the Viable Tumor by 19F-MRI and Multispectral Analysis.Neoplasia. 2017 Nov;19(11):950-959. doi: 10.1016/j.neo.2017.07.010. Epub 2017 Oct 6. Neoplasia. 2017. PMID: 28987998 Free PMC article.
-
Radiosensitizing oxygenation changes in murine tumors treated with VEGF-ablation therapy are measurable using oxygen enhanced-MRI (OE-MRI).Radiother Oncol. 2023 Oct;187:109795. doi: 10.1016/j.radonc.2023.109795. Epub 2023 Jul 5. Radiother Oncol. 2023. PMID: 37414252
-
Longitudinal imaging studies of tumor microenvironment in mice treated with the mTOR inhibitor rapamycin.PLoS One. 2012;7(11):e49456. doi: 10.1371/journal.pone.0049456. Epub 2012 Nov 20. PLoS One. 2012. PMID: 23185335 Free PMC article.
-
Noninvasive monitoring of radiotherapy-induced microvascular changes using dynamic contrast enhanced magnetic resonance imaging (DCE-MRI) in a colorectal tumor model.Int J Radiat Oncol Biol Phys. 2006 Mar 15;64(4):1188-96. doi: 10.1016/j.ijrobp.2005.10.026. Epub 2006 Feb 2. Int J Radiat Oncol Biol Phys. 2006. PMID: 16457965
Cited by
-
Assessing Tumor Oxygenation for Predicting Outcome in Radiation Oncology: A Review of Studies Correlating Tumor Hypoxic Status and Outcome in the Preclinical and Clinical Settings.Front Oncol. 2017 Jan 25;7:10. doi: 10.3389/fonc.2017.00010. eCollection 2017. Front Oncol. 2017. PMID: 28180110 Free PMC article. Review.
-
Monitoring the Process of Endostar-Induced Tumor Vascular Normalization by Non-contrast Intravoxel Incoherent Motion Diffusion-Weighted MRI.Front Oncol. 2018 Nov 13;8:524. doi: 10.3389/fonc.2018.00524. eCollection 2018. Front Oncol. 2018. PMID: 30483478 Free PMC article.
-
Tracking Perfluorocarbon Nanoemulsion Delivery by 19F MRI for Precise High Intensity Focused Ultrasound Tumor Ablation.Theranostics. 2017 Jan 7;7(3):562-572. doi: 10.7150/thno.16895. eCollection 2017. Theranostics. 2017. PMID: 28255351 Free PMC article.
-
Immune-Mediated Antitumor Effect By VEGFR2 Selective Inhibitor For Gastric Cancer.Onco Targets Ther. 2019 Nov 15;12:9757-9765. doi: 10.2147/OTT.S233496. eCollection 2019. Onco Targets Ther. 2019. PMID: 31814734 Free PMC article.
-
Development of multifunctional Overhauser-enhanced magnetic resonance imaging for concurrent in vivo mapping of tumor interstitial oxygenation, acidosis and inorganic phosphate concentration.Sci Rep. 2019 Aug 20;9(1):12093. doi: 10.1038/s41598-019-48524-3. Sci Rep. 2019. PMID: 31431629 Free PMC article.
References
-
- Horsman MR, Mortensen LS, Petersen JB, Busk M, Overgaard J. Imaging hypoxia to improve radiotherapy outcome. Nat Rev Clin Oncol. 2012;9:674–687. - PubMed
-
- Wilson WR, Hay MP. Targeting hypoxia in cancer therapy. Nat Rev Cancer. 2011;11:393–410. - PubMed
-
- Dardzinski BJ, Sotak CH. Rapid tissue oxygen tension mapping using 19F inversion-recovery echo-planar imaging of perfluoro-15-crown-5-ether. Magn Reson Med. 1994;32:88–97. - PubMed
-
- Hunjan S, Zhao DW, Constantinescu A, Hahn EW, Antich PP, Mason RP. Tumor oximetry: demonstration of an enhanced dynamic mapping procedure using fluorine-19 echo planar magnetic resonance imaging in the Dunning prostate R3327-AT1 rat tumor. Int J Radiat Oncol Biol Phys. 2001;49:1097–1108. - PubMed
MeSH terms
Substances
LinkOut - more resources
Full Text Sources
Other Literature Sources
Medical
Molecular Biology Databases
Miscellaneous