. 2013 Nov;15(11):1292-300.
doi: 10.1593/neo.131310.

ETV6/RUNX1 induces reactive oxygen species and drives the accumulation of DNA damage in B cells

Affiliations

ETV6/RUNX1 induces reactive oxygen species and drives the accumulation of DNA damage in B cells

Hans-Peter Kantner et al. Neoplasia. 2013 Nov.

Abstract

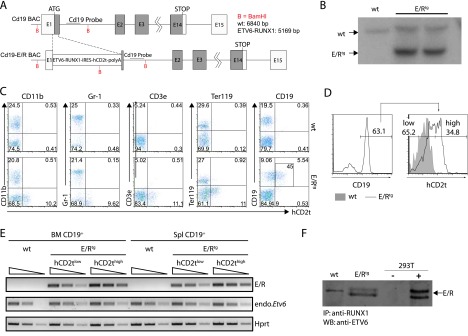
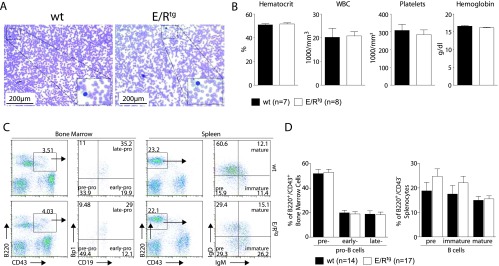
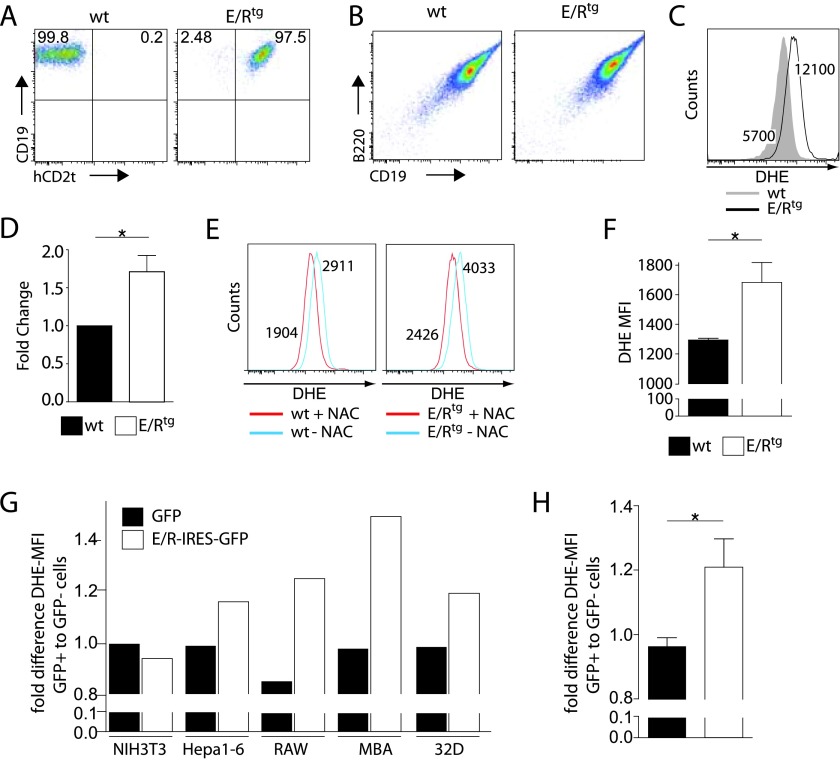
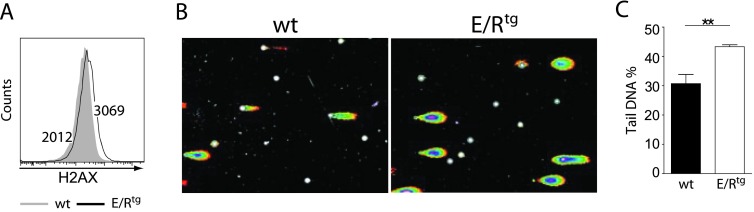
The t(12;21)(p13;q22) chromosomal translocation is the most frequent translocation in childhood B cell precursor-acute lymphoblastic leukemia and results in the expression of an ETV6/RUNX1 fusion protein. The frequency of ETV6/RUNX1 fusions in newborns clearly exceeds the leukemia rate revealing that additional events occur in ETV6/RUNX1-positive cells for leukemic transformation. Hitherto, the mechanisms triggering these second hits remain largely elusive. Thus, we generated a novel ETV6/RUNX1 transgenic mouse model where the expression of the fusion protein is restricted to CD19(+) B cells. These animals harbor regular B cell development and lack gross abnormalities. We established stable pro-B cell lines carrying the ETV6/RUNX1 transgene that allowed us to investigate whether ETV6/RUNX1 itself favors the acquisition of second hits. Remarkably, these pro-B cell lines as well as primary bone marrow cells derived from ETV6/RUNX1 transgenic animals display elevated levels of reactive oxygen species (ROS) as tested with ETV6/RUNX1 transgenic dihydroethidium staining. In line, intracellular phospho-histone H2AX flow cytometry and comet assay revealed increased DNA damage indicating that ETV6/RUNX1 expression enhances ROS. On the basis of our data, we propose the following model: the expression of ETV6/RUNX1 creates a preleukemic clone and leads to increased ROS levels. These elevated ROS favor the accumulation of secondary hits by increasing genetic instability and double-strand breaks, thus allowing preleukemic clones to develop into fully transformed leukemic cells.


Figures

Figure 1
Figure 1
Design of BAC and expression analysis of the ETV6/RUNX1 transgene. (A) The ETV6/RUNX1-IRES-hCD2t expression cassette was inserted in the first exon of the Cd19 gene. (B) Southern blot analysis of the Cd19 locus in an ETV6/RUNX1 founder mouse. Genomic DNA was digested with BamHI, blotted on a nitrocellulose membrane, and hybridized with a radiolabeled DNA probe against the proximal region of the Cd19 intron 1. The expected insertion of the ETV6/RUNX1-IRES-hCD2t-polyA cassette gives rise to a labeled DNA fragment of 5169 bp in contrast to the wt Cd19 allele (6840 bp). (C) The reporter hCD2t is specifically expressed in CD19+ cells. BM cells of wt mice (upper panel) and E/R-expressing mice (lower panel) were isolated, stained for surface markers CD11b, Gr1, CD3e, Ter119 as well as CD19, and analyzed by flow cytometry. The reporter gene hCD2t is only expressed in CD19+ cells but not in other hematopoietic lineages. Black inlet shows percentage of hCD2t+ cells from the CD19-expressing population. (D) Distribution of the hCD2t expression levels on the entire CD19+ cell fraction. One representative histogram of hCD2thigh/low-expressing CD19+ cells is shown. (E) mRNA expression analysis for ETV6/RUNX1 and Etv6 in semiquantitative reverse transcription-PCR in FACS-sorted hCD2tlow/high cells of the BM and the spleen of wt and E/Rtg mice. The wedge shows five-fold dilution series. (F) ETV6/RUNX1 protein expression was analyzed by immunoprecipitation (anti-RUNX1) and Western blot analysis (anti-ETV6) from E/Rtg and wt fetal liver-derived B cell lines. As control, 293T cells transiently transfected with an E/R-expressing plasmid were used. An unspecific antibody cross-hybridization signal is visible in some of the samples (wt).
Figure 2
Figure 2
Effects of ETV6/RUNX1 expression on blood physiology and B cell development. (A) Representative blood smears of 8-week-old wt and E/Rtg mice. (B) Blood parameters of wt (n = 7) and E/Rtg (n = 8) mice as measured by scil Vet ABC. Statistical analysis using unpaired t test revealed no differences. (C) Flow cytometric analysis of B cell development. Shown are representative dot plots. Different developmental B cell stages are indicated in the quadrants of the dot plots as pre, early, and late and pre, immature, and mature. (D) Statistical analysis of B cell development of wt and E/Rtg mice using Student's unpaired t test. A summary of three experiments is shown.
Figure 3
Figure 3
E/R expression induces ROS production in vitro and in vivo. (A and B) Fetal liver cells of wt and E/Rtg mice were infected with a retrovirus encoding for p160v-ABL. Stably transformed pro-B cell lines were analyzed for the expression of the surface markers (A) CD19 and hCD2t as well as (B) CD19 and B220. (C) wt and E/Rtg cell lines were stained with DHE and subsequently analyzed by flow cytometry to measure differences in ROS level. One representative histogram is depicted. (D) A summary of all experiments using wt and E/Rtg cell lines stained with DHE is shown. Statistical analysis was carried out by one-tailed paired t test (P = .04). (E) wt and E/Rtg cell lines were treated for 24 hours with 5 mM ROS scavenger NAC and analyzed for ROS by flow cytometry. Depicted are histograms for wt (left panel) and E/Rtg (right panel) untreated cells and cells treated with NAC. (F) CD19+ BM cells of E/Rtg (n = 16) and control littermate mice (n =10) were analyzed for ROS levels. Bar graphs represent DHE-MFI ± SD; statistical differences were revealed using unpaired t test. (G) Indicated human and murine cell lines were transfected with a retrovirus encoding for E/R-IRES-GFP or GFP. The fold difference in DHE-MFI of GFP-positive versus GFP-negative cells is shown. (H) Bar graphs depict average fold change in DHE-MFI on E/R or GFP expression ± SD of all five cell lines analyzed. *P < .05 (unpaired t test).
Figure 4
Figure 4
E/R expression induces DNA damage in wt and E/Rtg cells. (A) wt and E/Rtg cell lines were stained for γH2AX and analyzed by flow cytometry. One representative histogram is shown. (B and C) Comet assay of MACS-enriched CD19+ B cells derived from BM of wt and E/Rtg mice. Two mice of each genotype were pooled before MACS. (B) Representative pictures of comets of each genotype. (C) Statistical analysis (unpaired t test) of comet assay of wt and E/Rtg mice (n = 6 each) is depicted. Fifty pictures per sample were taken for statistical analysis of percentage of tail DNA. Average ± SD of each sample is shown.

Similar articles

Cited by

References

    1. Fears S, Gavin M, Zhang DE, Hetherington C, Ben-David Y, Rowley JD, Nucifora G. Functional characterization of ETV6 and ETV6/CBFA2 in the regulation of the MCSFR proximal promoter. Proc Natl Acad Sci USA. 1997;94:1949–1954. - PMC - PubMed
    1. Fears S, Vignon C, Bohlander SK, Smith S, Rowley JD, Nucifora G. Correlation between the ETV6/CBFA2 (TEL/AML1) fusion gene and karyotypic abnormalities in children with B-cell precursor acute lymphoblastic leukemia. Genes Chromosomes Cancer. 1996;17:127–135. - PubMed
    1. Golub TR, Barker GF, Bohlander SK, Hiebert SW, Ward DC, Bray-Ward P, Morgan E, Raimondi SC, Rowley JD, Gilliland DG. Fusion of the TEL gene on 12p13 to the AML1 gene on 21q22 in acute lymphoblastic leukemia. Proc Natl Acad Sci USA. 1995;92:4917–4921. - PMC - PubMed
    1. Romana SP, Mauchauffé M, Le Coniat M, Chumakov I, Le Paslier D, Berger R, Bernard OA. The t(12;21) of acute lymphoblastic leukemia results in a tel-AML1 gene fusion. Blood. 1995;85:3662–3670. - PubMed
    1. Greaves MF, Maia AT, Wiemels JL, Ford AM. Leukemia in twins: lessons in natural history. Blood. 2003;102:2321–2333. - PubMed

Publication types

MeSH terms