. 2013 Dec;11(12):e1001733.
doi: 10.1371/journal.pbio.1001733. Epub 2013 Dec 10.

Circadian period integrates network information through activation of the BMP signaling pathway

Affiliations

Circadian period integrates network information through activation of the BMP signaling pathway

Esteban J Beckwith et al. PLoS Biol. 2013 Dec.

Abstract

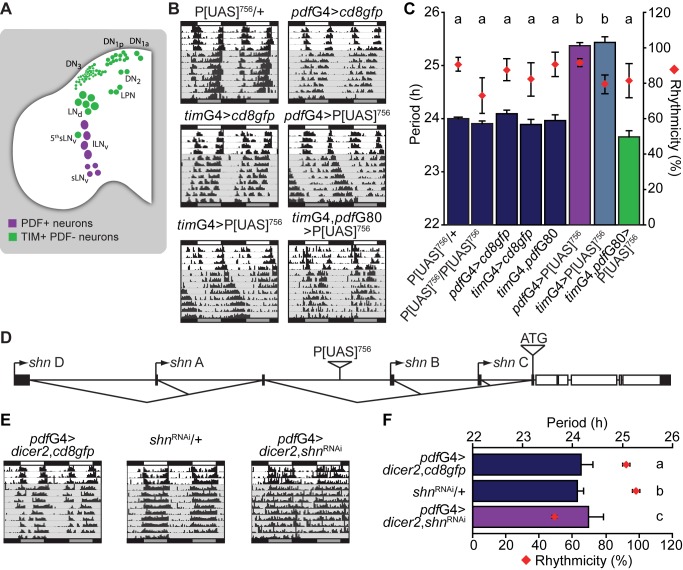
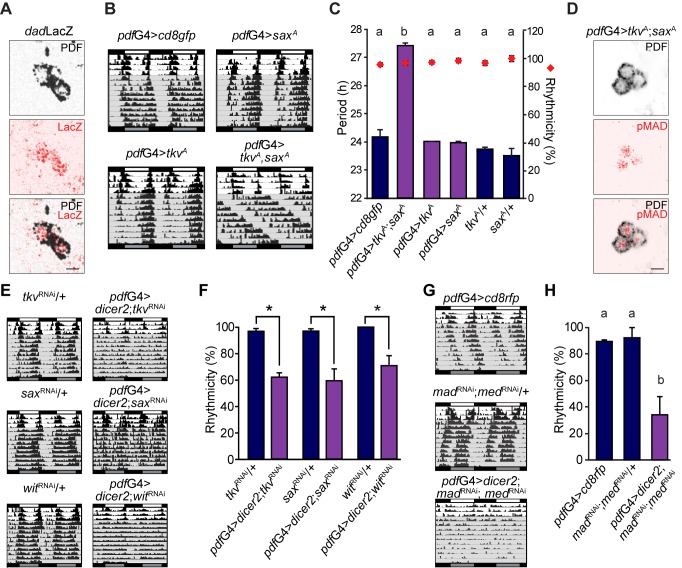
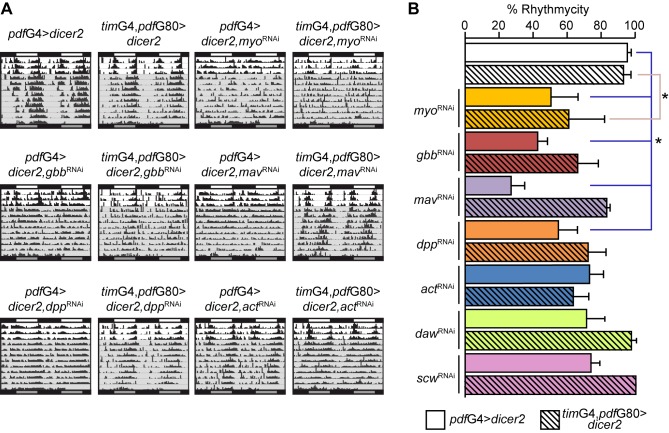
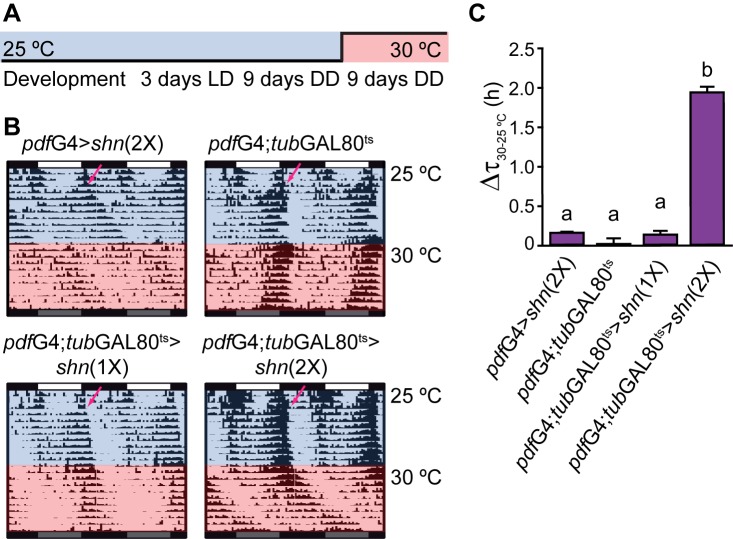
Living organisms use biological clocks to maintain their internal temporal order and anticipate daily environmental changes. In Drosophila, circadian regulation of locomotor behavior is controlled by ∼150 neurons; among them, neurons expressing the PIGMENT DISPERSING FACTOR (PDF) set the period of locomotor behavior under free-running conditions. To date, it remains unclear how individual circadian clusters integrate their activity to assemble a distinctive behavioral output. Here we show that the BONE MORPHOGENETIC PROTEIN (BMP) signaling pathway plays a crucial role in setting the circadian period in PDF neurons in the adult brain. Acute deregulation of BMP signaling causes period lengthening through regulation of dClock transcription, providing evidence for a novel function of this pathway in the adult brain. We propose that coherence in the circadian network arises from integration in PDF neurons of both the pace of the cell-autonomous molecular clock and information derived from circadian-relevant neurons through release of BMP ligands.


Conflict of interest statement

The authors have declared that no competing interests exist.

Figures

Figure 1
Figure 1. schnurri deregulation modulates locomotor behavior in PDF+ cells.
(A) Schematic diagram of a fly brain hemisphere displaying all clock-gene expressing neurons. lLNvs, large ventral Lateral Neurons; sLNvs, small ventral Lateral Neurons; LNds, dorsal Lateral Neurons; DN1as, Dorsal Neurons 1 anterior; DN1ps, Dorsal Neurons 1 posterior; DN2s, Dorsal Neurons 2; DN3s, Dorsal Neurons 3; LPNs, lateral posterior neurons. Modified from Muraro et al. . PDF+ and TIM+PDF− neurons were color-coded to facilitate their identification throughout. (B) shn overexpression lengthens the endogenous period. Representative double-plotted actograms of individual flies of the indicated genotypes. During the experiments, flies were kept in LD for 4 d, then switched to DD (shaded gray area), and monitored for 8 additional days. (C) Graph shows the quantitation of period and rhythmicity for the indicated genotypes; bars and diamonds represent average period and percentage of rhythmicity, respectively. Statistical analysis included one-way ANOVA for period determination, and different letters indicate significant differences in Tukey comparisons, α = 0.05. Purple bars indicate the treatments in which the BMP pathway is being modulated in PDF+ neurons. (D) Schematic diagram of the shn locus; the four alternative transcription initiation sites, the relative position of the transposon, and the common translation initiation site (ATG) are indicated (not to scale). Black boxes, untranslated regions; white boxes, coding region. (E) shn knockdown leads to deconsolidation of locomotor activity. Representative double-plotted actograms of individual flies of the indicated genotypes. During the experiments, flies were kept in LD for 3 d, then switched to DD (shaded gray area), and monitored for 9 additional days. (F) Graph shows the quantitation of period and rhythmicity for the indicated genotypes (see legend to Figure 1C for more details). Statistical analysis for rhythmicity data included one-way ANOVA, and different letters indicate significant differences in Tukey comparisons, α = 0.05. Error bars represent SEM and averages of at least three independent experiments. See Tables S1 and S2 for details.
Figure 2
Figure 2. The BMP pathway is active in adult core pacemaker neurons.
(A) The BMP target gene dad is expressed in the sLNvs. Brains dissected from dadLacZ reporter flies were immunostained with anti-PDF (black) and anti-LacZ (red) antibodies at ZT 02. Images correspond to the sLNvs. Scale bar, 5 µm. (B) Concomitant expression of tkv A and sax A slows the pace of the clock. Representative double-plotted actograms of flies of the indicated genotypes. Behavioral experiments were carried out as detailed in the legend to Figure 1E. (C) Graph shows the quantitation of period and rhythmicity for the indicated genotypes (see legend to Figure 1C for more details). Period data were analyzed with one-way ANOVA, and different letters indicate significant differences in Tukey comparisons, α = 0.05. (D) mad is expressed in pacemaker neurons. The sLNvs from an adult brain expressing both tkv A and sax A stained for anti-PDF and anti-pMad are shown. Scale bar, 5 µm. (E) Constitutive down-regulation of type I receptors results in deconsolidated activity. Representative double-plotted actograms of flies of the indicated genotypes. Behavioral experiments were carried out as detailed in the legend to Figure 1E. (F) Percentage of rhythmicity for each indicated genotype, * p<0.05 (Student's t test). (G) Joint mad and med down-regulation induces strong arrhythmicity. Representative double-plotted actograms of flies of the indicated genotypes. Behavioral experiments were carried out as detailed in the legend to Figure 1E. (H) The graph shows the quantitation of rhythmicity for the indicated genotypes. Data were analyzed with one-way ANOVA, and different letters indicate significant differences in Tukey comparisons, α = 0.05. Error bars represent SEM and averages describe a minimum of three independent experiments. See Tables S1 and S2 for details.
Figure 3
Figure 3. A combination of BMP ligands orchestrate the function of the circadian network.
(A) Representative double-plotted actograms of flies of the indicated genotypes. Behavioral experiments were carried out as detailed in the legend to Figure 1E. (B) Graph shows the quantitation of rhythmicity for the indicated genotypes. Statistical analysis included one-way ANOVA; * indicates significantly different treatments in Tukey comparisons, α = 0.05. Error bars represent SEM and averages represent at least three independent experiments. See Table S3 for details.
Figure 4
Figure 4. schnurri acutely modulates behavior in adult flies.
(A) Schematic diagram of the experiment shown in Figure 3B and 3C; flies were raised at 25°C under LD cycles; 0–3-d-old flies were loaded activity monitors and entrained for 3 d in LD, and then transferred to DD. After 9 d in DD (at 25°C) the flies were transferred to fresh test tubes and kept at 30°C (permissive temperature) in constant darkness for additional 9 d. (B) Representative double-plotted actograms of flies of the indicated genotypes. The blue and red shadows represent the phase at the restricted (25°C) and permissive (30°C) temperature, respectively. Arrows indicate the transfer to DD. (C) Bar diagram shows the difference between the endogenous period at the permissive and restrictive temperatures for each specific genotype. Data were analyzed with one-way ANOVA, and different letters indicate significant differences in Tukey comparisons, α = 0.05.
Figure 5
Figure 5. PER accumulation and nuclear entry are delayed in shn overexpressing sLNvs.
(A) Whole mount brain immunofluorescence was performed to follow PDF (upper panel) and PER (middle) accumulation during the transition between DD3 and DD4. Representative single plane confocal images of sLNvs for the indicated time points and genotypes are shown. Images were taken employing the same confocal settings throughout an individual time course. The experiment was repeated three times with similar results. Scale bar, 5 µm. (B) Quantitation of PER nuclear intensity. The nuclear area was delimited using the GFPNLS signal, so that PER immunoreactivity quantitation was restricted to that area; the PDF positive staining and cell body size was used to identify sLNvs. Between 9 and 10 brains were analyzed per time point; the average of 2–4 neurons was used for each determination. Three independent experiments were analyzed with two-way ANOVA; the interaction between factors was significant and simple effects were analyzed comparing genotypes, CT24 p = 0.0452 (**) and CT03 p = 0,067 (*).
Figure 6
Figure 6. Increased PER and TIM levels rescue the behavioral phenotype associated with shn overexpression.
(A) Representative double-plotted actograms of flies of the indicated genotypes. Behavioral experiments were carried out as detailed in the legend to Figure 1E. (B) Graph shows the quantitation of period and rhythmicity for the indicated genotypes (see legend to Figure 1C for more details). Statistical analysis included one-way ANOVA for period determination, and different letters indicate significant differences in Tukey comparisons, α = 0.05. Error bars represent SEM, and averages represent at least three independent experiments. See Table S1 for details. (C) per and tim are transcriptionally modulated by shn. Luciferase activity from total head extracts was measured at ZT02 in transgenic flies carrying per (upper panel) or tim (bottom panel) transcriptional reporters combined with shn overexpression in the entire clock circuit (tim-G4). Three independent experiments were carried out. Data from each experiment were normalized against the mean value of all measurements to contemplate different absolute luciferase activity levels. Three independent experiments were carried out and were analyzed with Student's t test; per LUC p = 0.020, tim LUC p = 0.002.
Figure 7
Figure 7. SHN down-regulates CLK protein levels through modulation of Clk promoter activity.
(A) Representative double-plotted actograms of flies of the indicated genotypes. Behavioral experiments were carried out as detailed in the legend to Figure 1E. (B) Graph shows the quantitation of period and rhythmicity for the indicated genotypes (see legend to Figure 1C for more details). Statistical analysis included one-way ANOVA for period determination, and different letters indicate significant differences in Tukey comparisons, α = 0.05. Error bars represent SEM, and averages represent at least three independent experiments. See Table S1 for details. (C) The schematic diagram depicts the Clk locus highlighting the existence of five alternative transcripts (according to FlyBase) along with the DNA fragment contained in the GAL4 reporter line; gray boxes represent untranslated exons, red boxes indicate translated exons, and the green box indicates the fusion between the first 18 amino acids of CLK and the transcription factor GAL4 (not to scale). Putative MAD (red) and MED (blue) binding elements and the relative position within the locus are indicated. The Clk856GAL4 reporter line contains a total of 2,334 bp . (D) Whole mount brain immunofluorescence was performed to follow PDF (upper panel) and GFP (upper and bottom panels) accumulation at ZT2 in the −856 Clk reporter line (Clk 856). This time point was selected to reduce the impact of differences stemming from the period lengthening phenotype. Representative confocal images of sLNvs for the indicated genotypes are shown. Note that controls also include a second UAS-driven transgene. Scale bar, 5 µm. (E) Quantitation of GFP nuclear intensity. PDF+ staining and cell body size were used to identify sLNvs. A total of 8 to 10 brains were analyzed in each experiment; the average of 2–4 neurons was used for each determination, and the images were taken employing the same confocal settings throughout an individual experiment. Three independent experiments were carried out, and data were analyzed with Randomized Blocks ANOVA to contemplate potential differences due to the different confocal settings. Paired measurements are linked by colored lines. pblocks = 0.04, pgenotypes = 0.02. (F) Whole mount brain immunofluorescence was performed to follow PDF (upper panel) and CLK (upper and bottom panels) accumulation at ZT14 in the indicated genotypes. This time point was selected to maximize CLK levels and reduce the impact of the period lengthening phenotype. Scale bar, 5 µm. (G) Quantitation of CLK nuclear intensity, as described in (E). Five independent experiments were carried out, and data were analyzed with Student's t test, p = 0.017.
Figure 8
Figure 8. Retrograde signaling impacts period determination.
The figure depicts a model in which different ligands released from sLNv postsynaptic targets (TIM+PDF− as well as the lLNvs) modulate the activity of the BMP signaling cascade in the sLNvs acting through the TKV/SAX/WIT receptors. In turn, this signal results in a transcriptionally active complex (including schnurri) that down-regulates Clk expression. Reduced Clock levels would then give rise to decreased per transcription and therefore reduced PER levels, thus slowing the pace of the molecular oscillator.

Similar articles

Cited by

References

    1. Hardin PE (2011) Molecular genetic analysis of circadian timekeeping in Drosophila. Adv Genet 74: 141–173. - PMC - PubMed
    1. Sheeba V (2008) The Drosophila melanogaster circadian pacemaker circuit. J Genet 87: 485–493. - PubMed
    1. Ewer J, Frisch B, Hamblen-Coyle MJ, Rosbash M, Hall JC (1992) Expression of the period clock gene within different cell types in the brain of Drosophila adults and mosaic analysis of these cells' influence on circadian behavioral rhythms. J Neurosci 12: 3321–3349. - PMC - PubMed
    1. Helfrich-Forster C (1998) Robust circadian rhythmicity of Drosophila melanogaster requires the presence of lateral neurons: a brain-behavioral study of disconnected mutants. J Comp Physiol A 182: 435–453. - PubMed
    1. Renn SC, Park JH, Rosbash M, Hall JC, Taghert PH (1999) A pdf neuropeptide gene mutation and ablation of PDF neurons each cause severe abnormalities of behavioral circadian rhythms in Drosophila. Cell 99: 791–802. - PubMed

Publication types

MeSH terms

LinkOut - more resources