

HIV-1 transmission during early infection in men who have sex with men: a phylodynamic analysis
- PMID: 24339751
- PMCID: PMC3858227
- DOI: 10.1371/journal.pmed.1001568
HIV-1 transmission during early infection in men who have sex with men: a phylodynamic analysis
Abstract
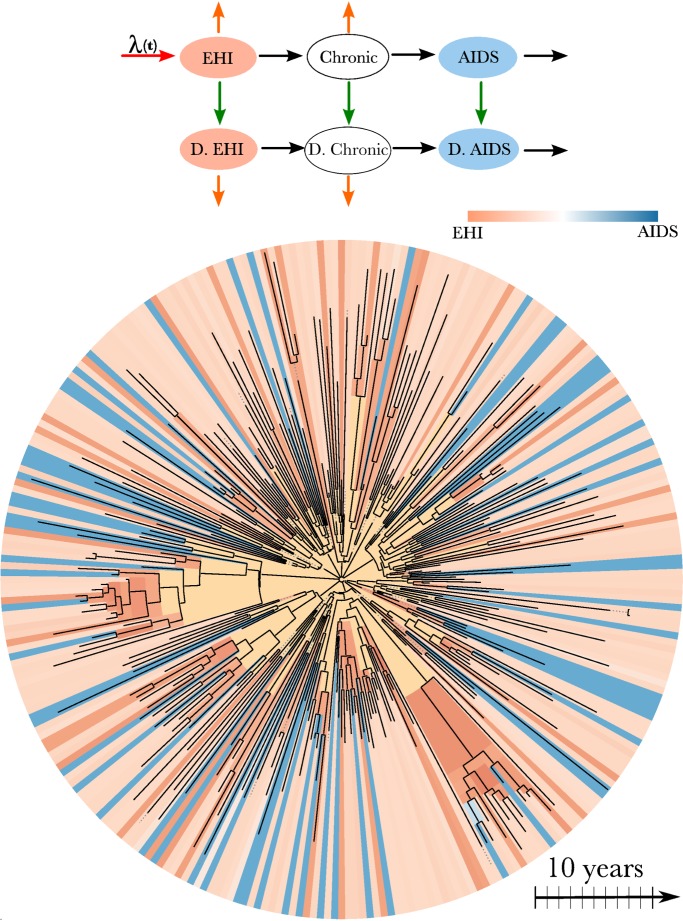
Background: Conventional epidemiological surveillance of infectious diseases is focused on characterization of incident infections and estimation of the number of prevalent infections. Advances in methods for the analysis of the population-level genetic variation of viruses can potentially provide information about donors, not just recipients, of infection. Genetic sequences from many viruses are increasingly abundant, especially HIV, which is routinely sequenced for surveillance of drug resistance mutations. We conducted a phylodynamic analysis of HIV genetic sequence data and surveillance data from a US population of men who have sex with men (MSM) and estimated incidence and transmission rates by stage of infection.
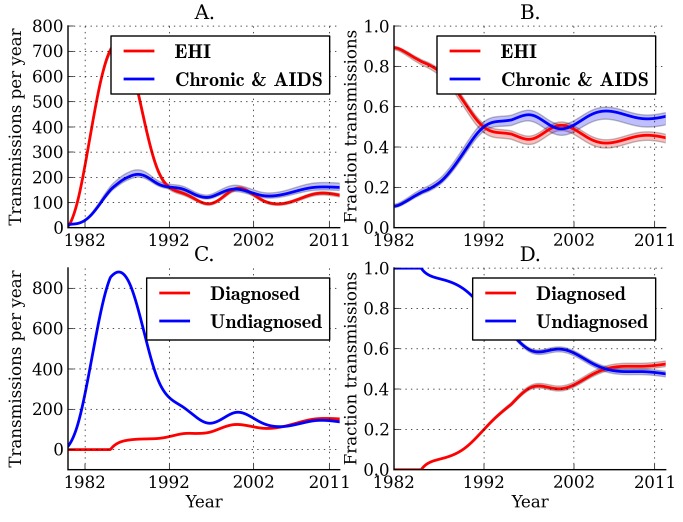
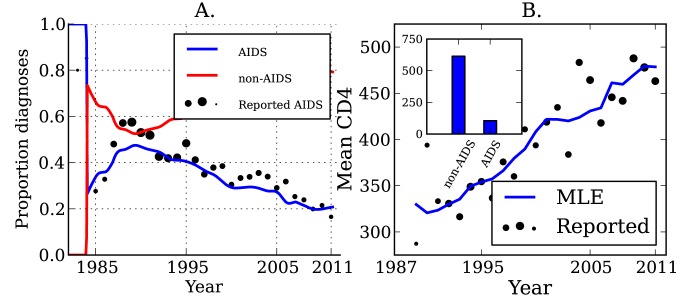
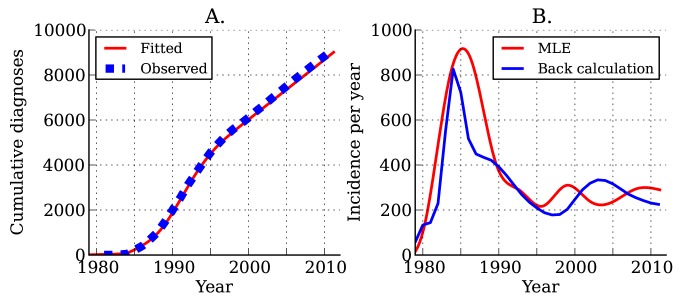
Methods and findings: We analyzed 662 HIV-1 subtype B sequences collected between October 14, 2004, and February 24, 2012, from MSM in the Detroit metropolitan area, Michigan. These sequences were cross-referenced with a database of 30,200 patients diagnosed with HIV infection in the state of Michigan, which includes clinical information that is informative about the recency of infection at the time of diagnosis. These data were analyzed using recently developed population genetic methods that have enabled the estimation of transmission rates from the population-level genetic diversity of the virus. We found that genetic data are highly informative about HIV donors in ways that standard surveillance data are not. Genetic data are especially informative about the stage of infection of donors at the point of transmission. We estimate that 44.7% (95% CI, 42.2%-46.4%) of transmissions occur during the first year of infection.
Conclusions: In this study, almost half of transmissions occurred within the first year of HIV infection in MSM. Our conclusions may be sensitive to un-modeled intra-host evolutionary dynamics, un-modeled sexual risk behavior, and uncertainty in the stage of infected hosts at the time of sampling. The intensity of transmission during early infection may have significance for public health interventions based on early treatment of newly diagnosed individuals.
Conflict of interest statement
EMV has recently been recruited to a faculty post within the same department as the academic editor (TBH). The authors have declared that no other competing interests exist.
Figures
Comment in
-
Early HIV infection in the United States: a virus's eye view.PLoS Med. 2013 Dec;10(12):e1001569. doi: 10.1371/journal.pmed.1001569. Epub 2013 Dec 10. PLoS Med. 2013. PMID: 24339752 Free PMC article.
References
-
- Pilcher C, Tien H, Eron J Jr, Vernazza P, Leu S, et al. (2004) Brief but efficient: acute HIV infection and the sexual transmission of HIV. J Infect Dis 189: 1785–1792. - PubMed
-
- Schneider E, Whitmore S, Glynn K, Dominguez K, Mitsch A, et al. (2008) Revised surveillance case definitions for HIV infection among adults, adolescents, and children aged <18 months and for HIV infection and AIDS among children aged 18 months to <13 years—United States, 2008. MMWR Recomm Rep 57: 1–12. - PubMed
Publication types
MeSH terms
Grants and funding
LinkOut - more resources
Full Text Sources
Other Literature Sources
Medical
