

A network inference method for large-scale unsupervised identification of novel drug-drug interactions
- PMID: 24339767
- PMCID: PMC3854677
- DOI: 10.1371/journal.pcbi.1003374
A network inference method for large-scale unsupervised identification of novel drug-drug interactions
Abstract
Characterizing interactions between drugs is important to avoid potentially harmful combinations, to reduce off-target effects of treatments and to fight antibiotic resistant pathogens, among others. Here we present a network inference algorithm to predict uncharacterized drug-drug interactions. Our algorithm takes, as its only input, sets of previously reported interactions, and does not require any pharmacological or biochemical information about the drugs, their targets or their mechanisms of action. Because the models we use are abstract, our approach can deal with adverse interactions, synergistic/antagonistic/suppressing interactions, or any other type of drug interaction. We show that our method is able to accurately predict interactions, both in exhaustive pairwise interaction data between small sets of drugs, and in large-scale databases. We also demonstrate that our algorithm can be used efficiently to discover interactions of new drugs as part of the drug discovery process.
Conflict of interest statement
The authors have declared that no competing interests exist.
Figures
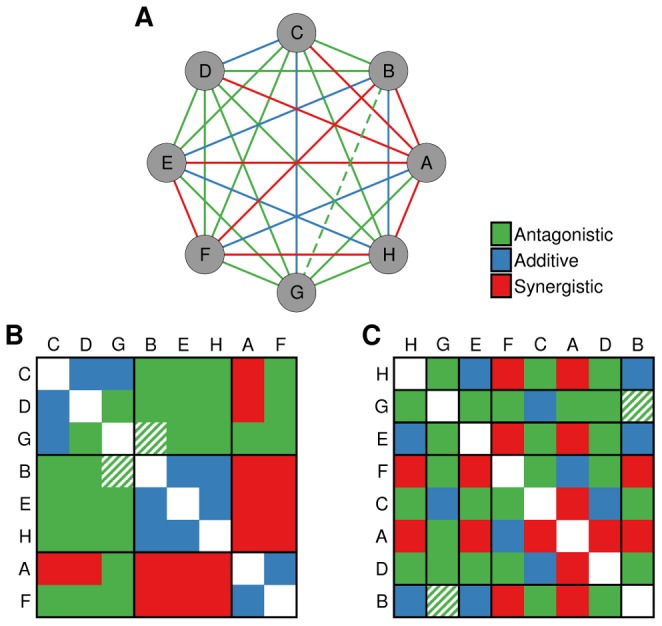
 are known with the exception of the interaction between
  and
and  , which is, in reality, antagonistic. There are many partitions of the drugs into groups. The partition in (B) has high explanatory power (low value of
  in Eqs. (5) and (6)), since most drug interactions between a pair of groups are of the same type. Therefore, the predictions of this partition have a large contribution to the estimation of the probability of the unknown interaction. Conversely, the partition depicted in (C) has little explanatory power (high value of
  ) and has a small contribution to the estimation of the probability of the unknown interaction.
 of all interactions are observed, and then try to predict the unobserved interactions (repeated random sub-sampling validation). In each case, we measure the fraction of predictions that are exactly correct (A and B), as well as the fraction of predictions that deviate from the experimental observation by at most one level (C and D). For example, miss-predicting a synergistic interaction as additive is considered correct by the
  classification metric, but miss-predicting a synergistic interactions as antagonistic or suppressing (or vice versa), or an additive one as suppressing (or vice versa) is considered incorrect. Error bars indicate the standard error of the mean and are usually smaller than the symbols. (E and F) Relative improvement of the stochastic block model predictions over the neighbor-based predictions. If
  is the frequency of correct classification, we define the relative improvement as
  , where SBM and B stand for stochastic block model and baseline, respectively, and X stands for any other approach (neighbor-based or Prism-based).
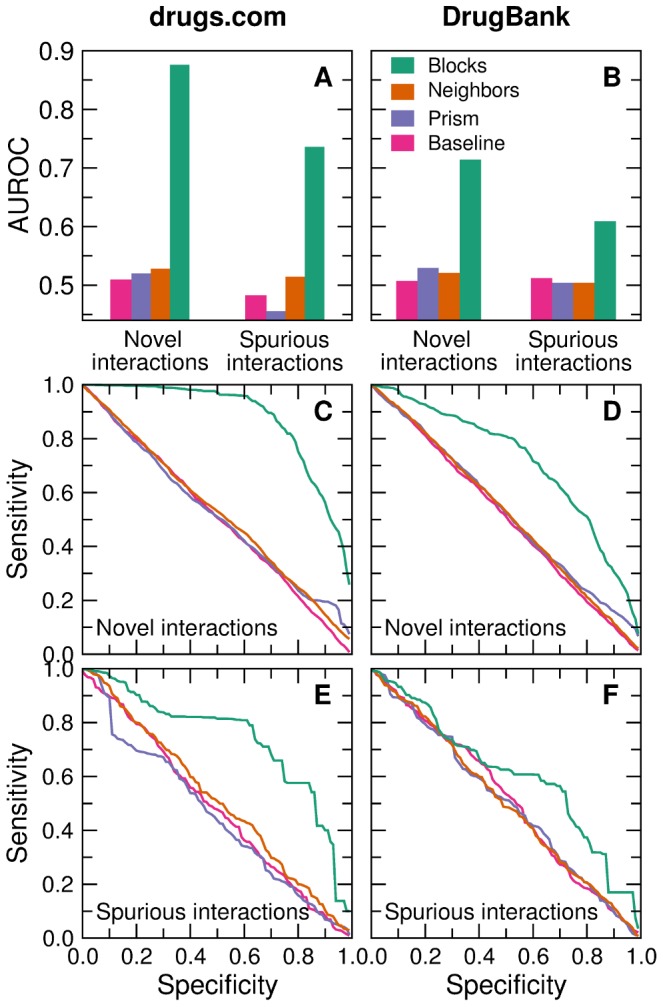

Similar articles
-
DT-Web: a web-based application for drug-target interaction and drug combination prediction through domain-tuned network-based inference.BMC Syst Biol. 2015;9 Suppl 3(Suppl 3):S4. doi: 10.1186/1752-0509-9-S3-S4. Epub 2015 Jun 1. BMC Syst Biol. 2015. PMID: 26050742 Free PMC article.
-
Deep-Learning-Based Drug-Target Interaction Prediction.J Proteome Res. 2017 Apr 7;16(4):1401-1409. doi: 10.1021/acs.jproteome.6b00618. Epub 2017 Mar 13. J Proteome Res. 2017. PMID: 28264154
-
Synergistic and antagonistic drug combinations depend on network topology.PLoS One. 2014 Apr 8;9(4):e93960. doi: 10.1371/journal.pone.0093960. eCollection 2014. PLoS One. 2014. PMID: 24713621 Free PMC article.
-
In-Silico Modeling in Drug Metabolism and Interaction: Current Strategies of Lead Discovery.Curr Pharm Des. 2019;25(31):3292-3305. doi: 10.2174/1381612825666190903155935. Curr Pharm Des. 2019. PMID: 31481001 Review.
-
Drug interactions and the evolution of antibiotic resistance.Nat Rev Microbiol. 2009 Jun;7(6):460-6. doi: 10.1038/nrmicro2133. Nat Rev Microbiol. 2009. PMID: 19444248 Free PMC article. Review.
Cited by
-
Synergistic drug combinations from electronic health records and gene expression.J Am Med Inform Assoc. 2017 May 1;24(3):565-576. doi: 10.1093/jamia/ocw161. J Am Med Inform Assoc. 2017. PMID: 27940607 Free PMC article.
-
Elucidation of pathways driving asthma pathogenesis: development of a systems-level analytic strategy.Front Immunol. 2014 Sep 23;5:447. doi: 10.3389/fimmu.2014.00447. eCollection 2014. Front Immunol. 2014. PMID: 25295037 Free PMC article. Review.
-
Prediction of drug cocktail effects when the number of measurements is limited.PLoS Biol. 2017 Oct 26;15(10):e2002518. doi: 10.1371/journal.pbio.2002518. eCollection 2017 Oct. PLoS Biol. 2017. PMID: 29073201 Free PMC article.
-
Predicting synergistic effects between compounds through their structural similarity and effects on transcriptomes.Bioinformatics. 2016 Dec 15;32(24):3782-3789. doi: 10.1093/bioinformatics/btw509. Epub 2016 Aug 18. Bioinformatics. 2016. PMID: 27540269 Free PMC article.
-
Synergy Maps: exploring compound combinations using network-based visualization.J Cheminform. 2015 Aug 1;7:36. doi: 10.1186/s13321-015-0090-6. eCollection 2015. J Cheminform. 2015. PMID: 26236402 Free PMC article.
References
-
- Chait R, Craney A, Kishony R (2007) Antibiotic interactions that select against resistance. Nature 446: 668–671. - PubMed
Publication types
MeSH terms
LinkOut - more resources
Full Text Sources
Other Literature Sources
Medical
