. 2013;9(12):e1003983.
doi: 10.1371/journal.pgen.1003983. Epub 2013 Dec 5.

Basolateral Mg2+ extrusion via CNNM4 mediates transcellular Mg2+ transport across epithelia: a mouse model

Affiliations

Basolateral Mg2+ extrusion via CNNM4 mediates transcellular Mg2+ transport across epithelia: a mouse model

Daisuke Yamazaki et al. PLoS Genet. 2013.

Abstract

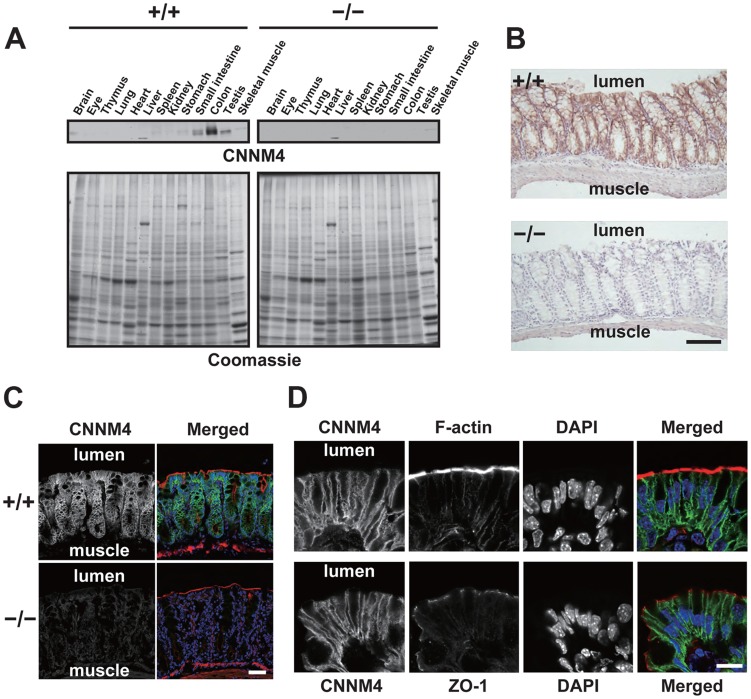
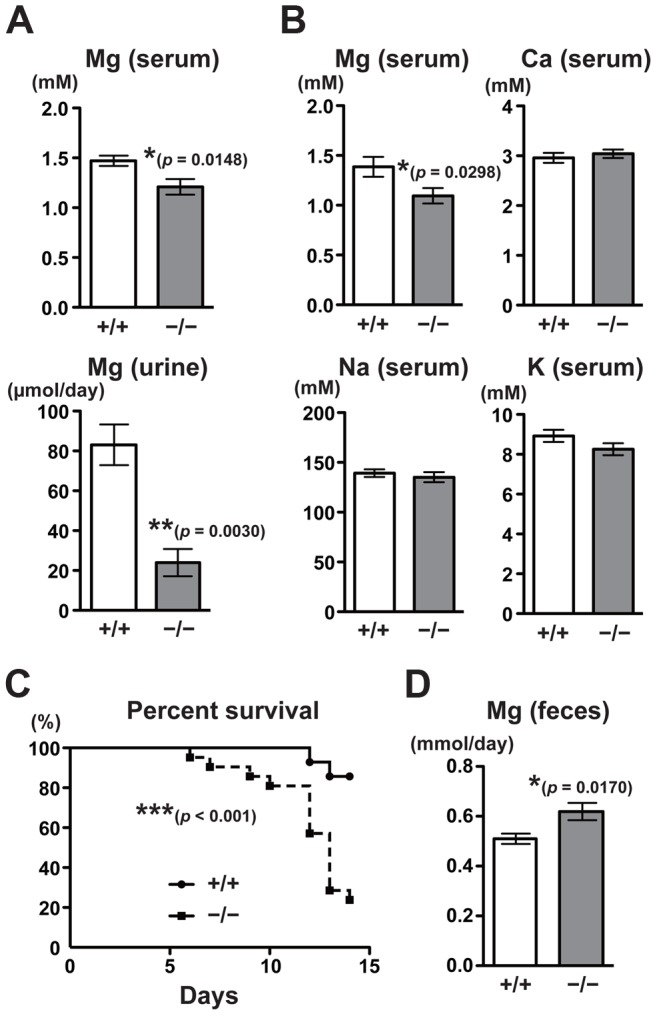
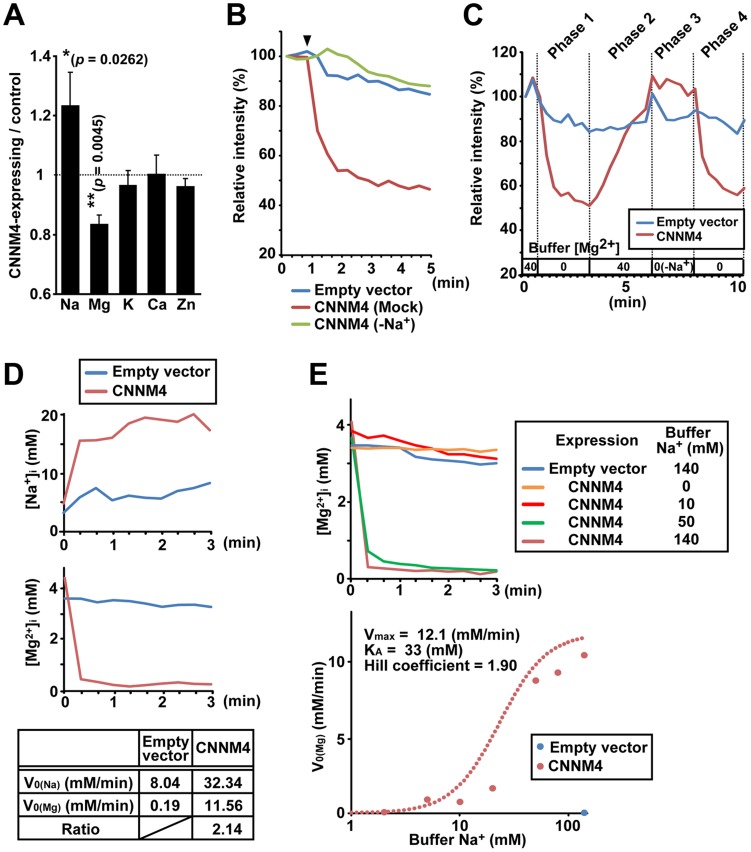
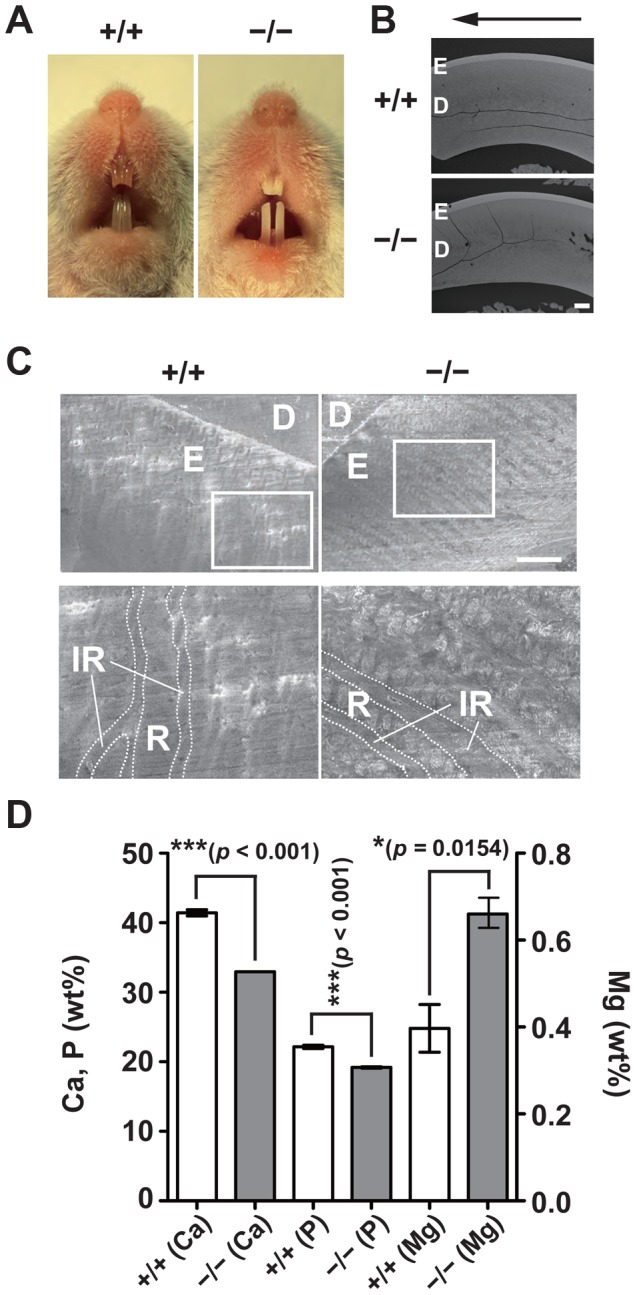
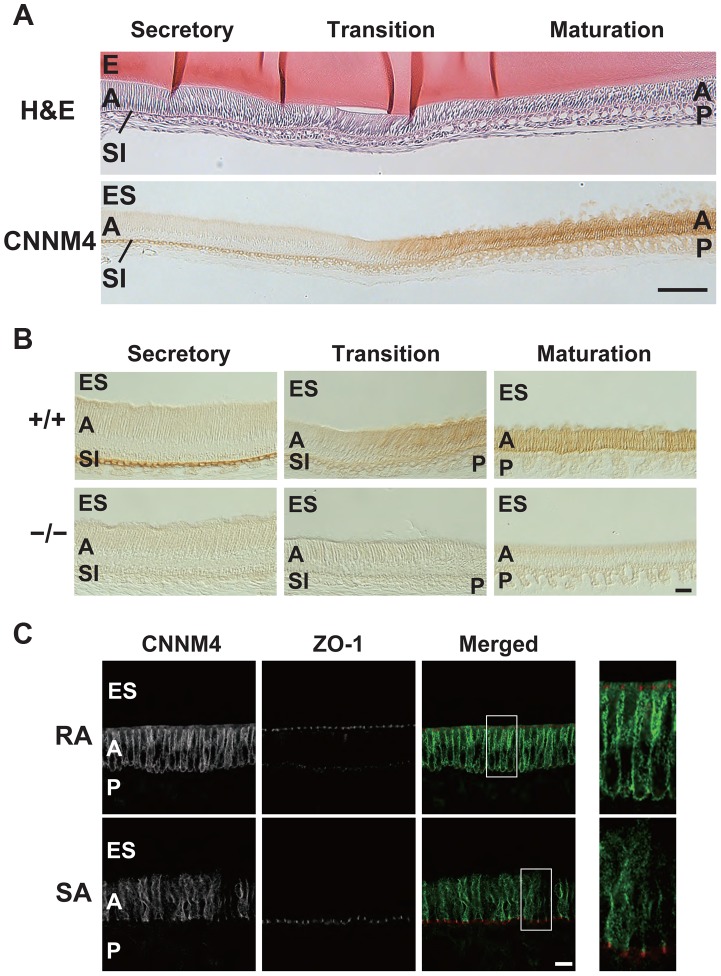
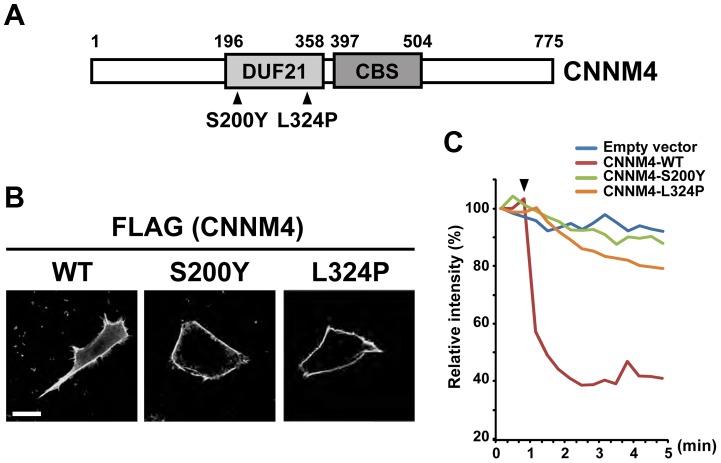
Transcellular Mg(2+) transport across epithelia, involving both apical entry and basolateral extrusion, is essential for magnesium homeostasis, but molecules involved in basolateral extrusion have not yet been identified. Here, we show that CNNM4 is the basolaterally located Mg(2+) extrusion molecule. CNNM4 is strongly expressed in intestinal epithelia and localizes to their basolateral membrane. CNNM4-knockout mice showed hypomagnesemia due to the intestinal malabsorption of magnesium, suggesting its role in Mg(2+) extrusion to the inner parts of body. Imaging analyses revealed that CNNM4 can extrude Mg(2+) by exchanging intracellular Mg(2+) with extracellular Na(+). Furthermore, CNNM4 mutations cause Jalili syndrome, characterized by recessive amelogenesis imperfecta with cone-rod dystrophy. CNNM4-knockout mice showed defective amelogenesis, and CNNM4 again localizes to the basolateral membrane of ameloblasts, the enamel-forming epithelial cells. Missense point mutations associated with the disease abolish the Mg(2+) extrusion activity. These results demonstrate the crucial importance of Mg(2+) extrusion by CNNM4 in organismal and topical regulation of magnesium.


Conflict of interest statement

The authors have declared that no competing interests exist.

Figures

Figure 1
Figure 1. Generation of CNNM4-knockout mice.
(A) Targeting strategy. βgal, β-galactosidase gene; DTA, diphtheria toxin A; FRT, Flp recombination target; IRES, internal ribosomal entry site; LoxP, locus of crossing over P1; Neo, neomycin resistance gene; SA, splice acceptor; V, EcoRV endonuclease-recognition site. (B) Genomic DNA, isolated from the tails of CNNM4+/+, CNNM4+/−, and CNNM4−/− mice was digested with EcoRV and hybridized with the external or neo probes, as schematically shown in (A). (C) PCR was performed using the genomic DNA as a template with the oligonucleotide primers schematically shown in (A). (D) Lysates of the colon were subjected to immunoblotting analyses with the anti-CNNM4 antibody.
Figure 2
Figure 2. Basolateral localization of CNNM4 in the intestinal epithelia.
(A) Lysates of various organs obtained from 2-month-old CNNM4+/+ and CNNM4−/− mice were subjected to immunoblotting analyses with the anti-CNNM4 antibody. Coomassie-stained images are also indicated. (B) Cryosections of the colon were subjected to immunohistochemical staining with the anti-CNNM4 antibody. Bar, 100 µm. (C) Cryosections of the colon were subjected to immunofluorescence staining with the anti-CNNM4 antibody (green), phalloidin (red), and DAPI (blue). Monochrome images for CNNM4 are also indicated. Bar, 50 µm. (D) Colonic epithelia facing the lumen were subjected to immunofluorescence staining with anti-CNNM4 antibody (green), DAPI (blue), and phalloidin (red, upper panels), or anti-ZO-1 antibody (red, lower panels). Monochrome images for each signal are also indicated. Bar, 10 µm.
Figure 3
Figure 3. Malabsorption of magnesium in CNNM4-KO mice.
(A) Magnesium quantitation in serum (n = 9) and urine (n = 4) obtained from 2-month-old CNNM4+/+ and CNNM4−/− mice. The data are shown as mean ± s.e.m.. P-values were determined by Student's two-tailed t-test (unpaired). *p<0.05, **p<0.01. (B) Serum samples were subjected to elemental analyses using ICP-ES. The data are shown as mean ± s.e.m. (n = 14). P-values were determined by Student's two-tailed t-test (unpaired). *p<0.05. (C) Survival of CNNM4+/+ (n = 11) and CNNM4−/− (n = 18) mice on a magnesium-deficient diet. ***p<0.001; p-values were determined using the log-rank test. (D) Magnesium quantitation in feces. The data are shown as mean ± s.e.m. (n = 8). P-values were determined by Student's two-tailed t-test (unpaired). *p<0.05.
Figure 4
Figure 4. Mg2+ extrusion by CNNM4.
(A) Lysates of HEK293 cells transfected with CNNM4-FLAG were subjected to ICP-ES analyses. Relative amount of each element (CNNM4-expressing cells/control cells) is shown as mean ± s.e.m. (n = 7). P-values were determined by Student's two-tailed t-test (paired). *p<0.05, **p<0.01. (B) HEK293 cells expressing CNNM4-FLAG were loaded with Magnesium Green, and then subjected to Mg2+ depletion at the indicated time point (arrowhead). The experiment was repeated in a Na+-depleted extracellular solution (−Na+) by replacing NaCl with NMDG-Cl. The means of relative fluorescence intensities of 10 cells are indicated. (C) HEK293 cells expressing CNNM4-FLAG were loaded with Magnesium Green and then subjected to time-lapse imaging analyses under various extracellular solutions. The Mg2+ concentration in the extracellular solution is indicated (−Na+: NaCl in the buffer was replaced with NMDG-Cl). The means of relative fluorescence intensities of 10 cells are indicated. (D) HEK293 cells expressing CNNM4-FLAG were loaded with SBFI or Mag-fura2, and then subjected to Mg2+ depletion at 0 min. The data are shown as the means of [Na+]i (SBFI-loaded cells, top) and [Mg2+]i (Mag-fura2-loaded cells, middle) from 6 independent experiments (10 cells for each experiment). Initial velocities of Na+ influx (V0 (Na)) and Mg2+ efflux (V0 (Mg)), and the ratio of CNNM4-dependent Na+ influx versus Mg2+ efflux are also indicated (bottom). See Materials and Methods for details. (E) HEK293 cells expressing CNNM4-FLAG were loaded with Mag-fura2, and subjected to Mg2+ depletion at 0 min with extracellular Mg2+-free buffers containing various concentrations of Na+. Top: Time course of [Mg2+]i (means of 3 independent experiments, and 10 cells for each experiment). Bottom: Values for V0 (Mg) are plotted against Na+ concentrations in the buffer. Hill-type curve is also indicated (dotted line).
Figure 5
Figure 5. Hypomineralization of the tooth enamel in CNNM4-knockout mice.
(A) Oral photographs showing incisors of 2-month-old CNNM4+/+ and CNNM4−/− mice. (B) Backscattered SEM images showing incisors of 2-month-old CNNM4+/+ and CNNM4−/− mice. An arrow shows incisal direction. E, enamel; D, dentine. Bar, 200 µm. (C) SEM images showing the mature enamel regions of incisors. Magnified images of the boxed areas are also indicated. E, enamel; D, dentine; R, enamel rod; IR, inter-rod area. Bar, 20 µm. (D) The mineral content of the incisor enamel. The mineral content is expressed as a weight percent (wt%). The data are shown as mean ± s.e.m. (n = 3). P-values were determined by Student's two-tailed t-test (unpaired). *p<0.05, ***p<0.001.
Figure 6
Figure 6. Basolateral localization of CNNM4 in the ameloblasts.
(A, B) The enamel-forming tissues of 6-week-old mice were subjected to H&E staining (A) and immunohistochemical staining with the anti-CNNM4 antibody. The specimens were observed with DIC microscope (B). E, enamel; ES, enamel space; A, ameloblast; SI, stratum intermedium; P, papillary layer. Bar, 100 µm (A), 20 µm (B). (C) Cryosections were double-stained with anti-CNNM4 (green) and anti-ZO-1 (red) antibodies, and subjected to immunofluorescence microscopy. RA, ruffle-ended ameloblast; SA, smooth-ended ameloblast; ES, enamel space; A, ameloblast; P, papillary layer. Magnified images of the boxed areas in the merged images are also indicated. Bar, 10 µm.
Figure 7
Figure 7. Mutations associated with Jalili syndrome abolish Mg2+ extrusion.
(A) Schematic illustration of CNNM4 and point mutations found in patients with Jalili syndrome. The evolutionarily conserved DUF21 and CBS domains are boxed and the amino acid residue numbers are indicated. (B) HEK293 cells transfected with the WT and mutant CNNM4-FLAG constructs were subjected to immunofluorescence staining with the anti-FLAG antibody. Bar, 10 µm. (C) HEK293 cells transfected with the WT and mutant CNNM4-FLAG constructs were subjected to Mg2+ extrusion assays. The arrowhead indicates the starting point of Mg2+ depletion. The means of relative fluorescence intensities of 10 cells are indicated.

References

    1. Simon DB, Lu Y, Choate KA, Velazquez H, Al-Sabban E, et al. (1999) Paracellin-1, a renal tight junction protein required for paracellular Mg2+ resorption. Science 285: 103–106. - PubMed
    1. Konrad M, Schaller A, Seelow D, Pandey AV, Waldegger S, et al. (2006) Mutations in the tight-junction gene claudin 19 (CLDN19) are associated with renal magnesium wasting, renal failure, and severe ocular involvement. Am J Hum Genet 79: 949–957. - PMC - PubMed
    1. Hou J, Paul DL, Goodenough DA (2005) Paracellin-1 and the modulation of ion selectivity of tight junctions. J Cell Sci 118: 5109–5118. - PubMed
    1. Schlingmann KP, Weber S, Peters M, Niemann Nejsum L, Vitzthum H, et al. (2002) Hypomagnesemia with secondary hypocalcemia is caused by mutations in TRPM6, a new member of the TRPM gene family. Nat Genet 31: 166–170. - PubMed
    1. Walder RY, Landau D, Meyer P, Shalev H, Tsolia M, et al. (2002) Mutation of TRPM6 causes familial hypomagnesemia with secondary hypocalcemia. Nat Genet 31: 171–174. - PubMed

Publication types

MeSH terms

Supplementary concepts