. 2010 May 6;7(5):10.5194/bg-7-1413-2010, 2010.
doi: 10.5194/bg-7-1413-2010.

BVOC fluxes above mountain grassland

Affiliations

BVOC fluxes above mountain grassland

I Bamberger et al. Biogeosciences. .

Abstract

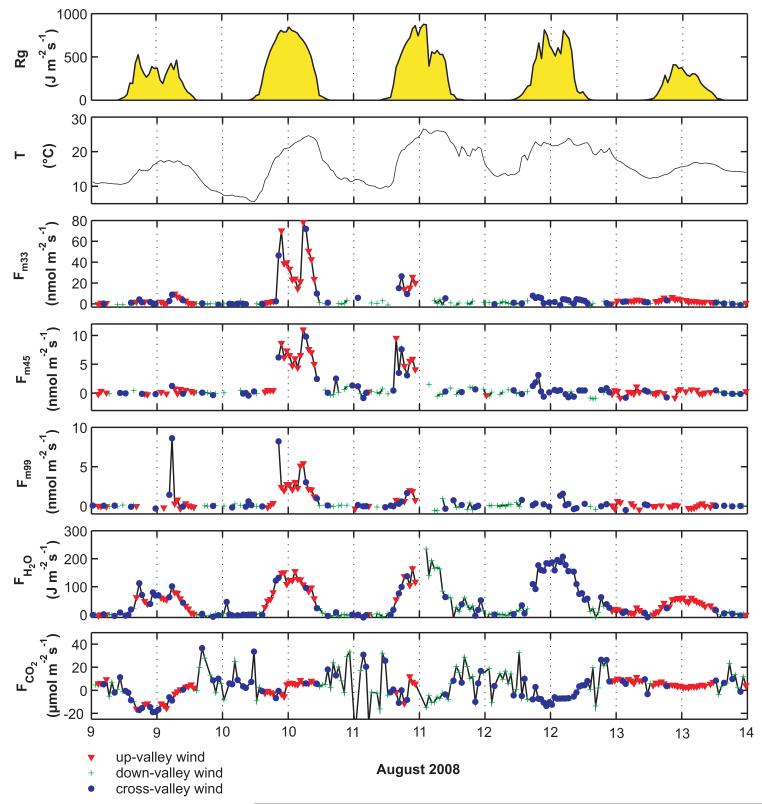
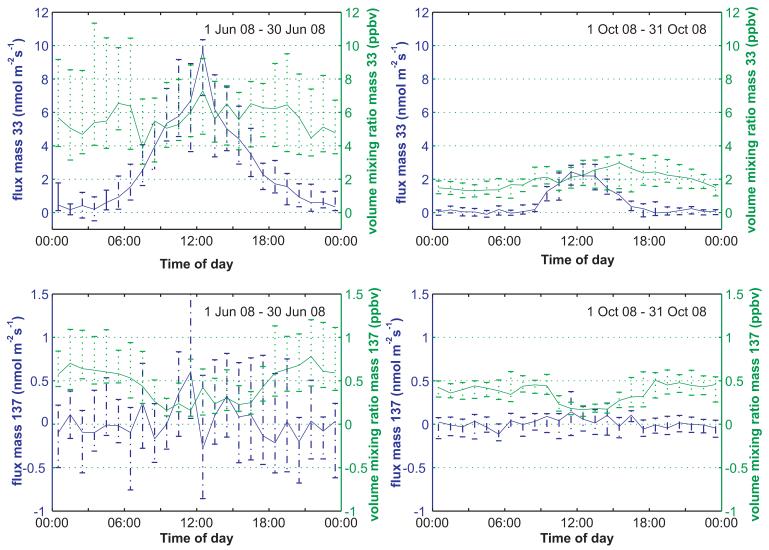
Grasslands comprise natural tropical savannah over managed temperate fields to tundra and cover one quarter of the Earth's land surface. Plant growth, maintenance and decay result in volatile organic compound (VOCs) emissions to the atmosphere. Furthermore, biogenic VOCs (BVOCs) are emitted as a consequence of various environmental stresses including cutting and drying during harvesting. Fluxes of BVOCs were measured with a proton-transfer-reaction-mass-spectrometer (PTR-MS) over temperate mountain grassland in Stubai Valley (Tyrol, Austria) over one growing season (2008). VOC fluxes were calculated from the disjunct PTR-MS data using the virtual disjunct eddy covariance method and the gap filling method. Methanol fluxes obtained with the two independent flux calculation methods were highly correlated (y = 0.95×-0.12, R2 = 0.92). Methanol showed strong daytime emissions throughout the growing season - with maximal values of 9.7 nmol m-2 s-1, methanol fluxes from the growing grassland were considerably higher at the beginning of the growing season in June compared to those measured during October (2.5 nmol m-2 s-1). Methanol was the only component that exhibited consistent fluxes during the entire growing periods of the grass. The cutting and drying of the grass increased the emissions of methanol to up to 78.4 nmol m-2 s-1. In addition, emissions of acetaldehyde (up to 11.0 nmol m-2 s-1), and hexenal (leaf aldehyde, up to 8.6 nmol m-2 s-1) were detected during/after harvesting.


Figures

Fig. 1
Fig. 1
Polar plot of the maximum of the footprint function xmax (dashed black line) and the frequency the wind direction during daytime (red line) and nighttime (yellow line) overlaid on an aerial picture (TIRIS, http://tiris.tirol.gv.at/) of the study site.
Fig. 2
Fig. 2
Schematical drawing of the PTR-MS inlet system and setup. During ambient air measurements outside air is drawn from the inlet line into the PTR-MS. For background measurements valve 2 is switched on and scrubbed ambient air obtained from a catalytic converter is guided to the instrument. For calibration measurements valve 1 is switched on to mix the selected gas standard flow (FC1) with the scrubbed ambient air (FC2 set to 500 ml).
Fig. 3
Fig. 3
Example (9 September 2008 10:45 CET) for the time delay between the methanol time series and the vertical wind velocity. Maximum covariances, i.e. lag times were 1.60 s for the vDEC method and 1.65 s for the gap filling method.
Fig. 4
Fig. 4
Comparison of the cospectra for the sensible heat (black triangles) and methanol flux (red points; gap filling method) together with the cospectral reference model (Wohlfahrt et al., 2005; black line) and the reference model attenuated by a series of transfer functions which account for high- and low-pass filtering of the methanol flux (red dashed line).
Fig. 5
Fig. 5
Random uncertainty of methanol flux (vDEC method) and CO2 flux (from Haslwanter et al., 2009) derived according to Hollinger and Richardson (2005). Data have been binned into classes of equal size. A double-linear relationship with a common y-intercept was fit to the methanol flux data: y = 0.31× + 0.58 (daytime, R2 = 0.83), y = −0.22× + 0.58 (nighttime, R2 = 0.71). Note that the x-axis for methanol fluxes was flipped in order to match CO2 fluxes which are opposite in sign.
Fig. 6
Fig. 6
Methanol fluxes calculated with the vDEC (upper left panel) and the gap filling (lower left panel) method and the scatter plot between both including the regression line. Both fluxes agree with a correlation coefficient of R2 = 0.92.
Fig. 7
Fig. 7
From the upper panels to the lower: Time series of the global radiation (Rg), temperature, methanol flux, acetaldehyde flux, flux m/z 99, latent heat flux and CO2 flux during the second hay harvest on the 10th of August 2008.
Fig. 8
Fig. 8
Median diurnal cycles of methanol (upper panels) and monoterpene (lower panels) volume mixing ratios (green lines) and fluxes (blue lines) including the 25% and 75% percentiles for the months June and October 2008.
Fig. 9
Fig. 9
Upper panels: Median diurnal cycles of the temperature including the 25% and 75% percentiles overlaid on the diurnal cycle of the global radiation for the months June and October 2008. Lower left and right panel: Polar plot of the median diurnal cycle of the horizontal wind speed in June 2008 and diurnal cycle of the latent heat flux for October 2008.

References

    1. Aubinet M, Grelle A, Ibrom A, Rannik Ü, Moncrieff J, Foken T, Kowalski AS, Martin PH, Berbigier P, Bernhofer Ch., Clement R, Ebers J, Granier A, Grünwald T, Morgenstern K, Pilegaard K, Rebmann C, Snijders W, Valentini R, Vesala T. Estimates of the annual net carbon and water exchange of forest: the EUROFLUX methodology. Adv. Ecol. Res. 2000;30:113–175.
    1. Baldocchi DD, Hicks BB, Meyers TP. Measuring biosphere-atmosphere exchangesof biologically related gases with micrometeorological methods. Ecology. 1988;69:1331–1340.
    1. Beauchamp J, Wisthaler A, Hansel A, Kleist E, Miebach M, Niinemets U, Schurr U, Wildt J. Ozone induced emissions of biogenic voc from tobacco: Relationships between ozone uptake and emission of lox products. Plant Cell Environ. 2005;28:1334–1343.
    1. Bertin N, Staudt M. Effect of water stress on monoterpene emissions from young potted holm oak (quercus ilex 1.) trees. Oecologia. 1996;107:456–462. - PubMed
    1. Brunner A, Ammann C, Neftel A, Spirig C. Methanol exchange between grassland and the atmosphere. Biogeosciences. 2007;4:395–410.

LinkOut - more resources