. 2010:4:10.2174/1874216501004010066.
doi: 10.2174/1874216501004010066.

High Fat Diet Regulation of β-Cell Proliferation and β-Cell Mass

Affiliations

High Fat Diet Regulation of β-Cell Proliferation and β-Cell Mass

M L Golson et al. Open Endocrinol J. 2010.

Abstract

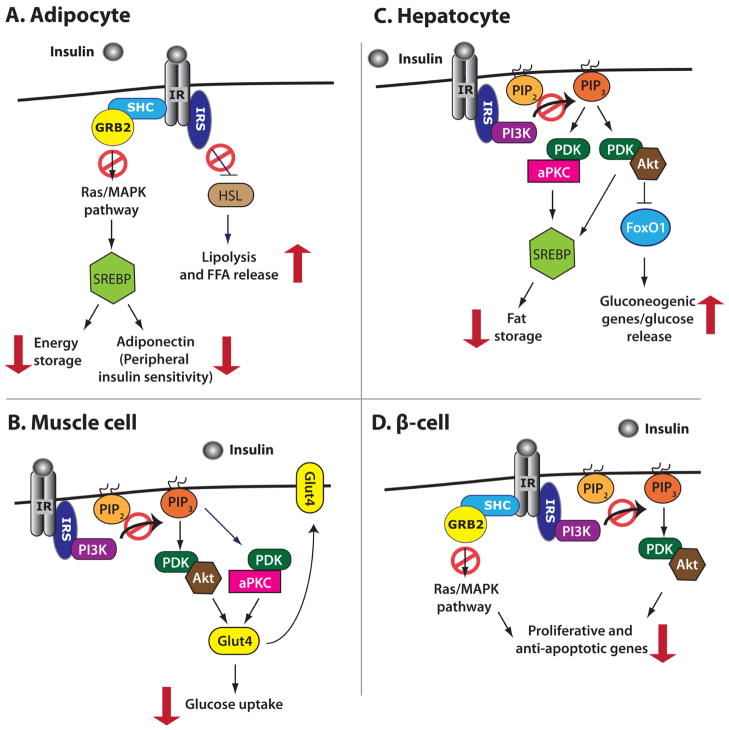
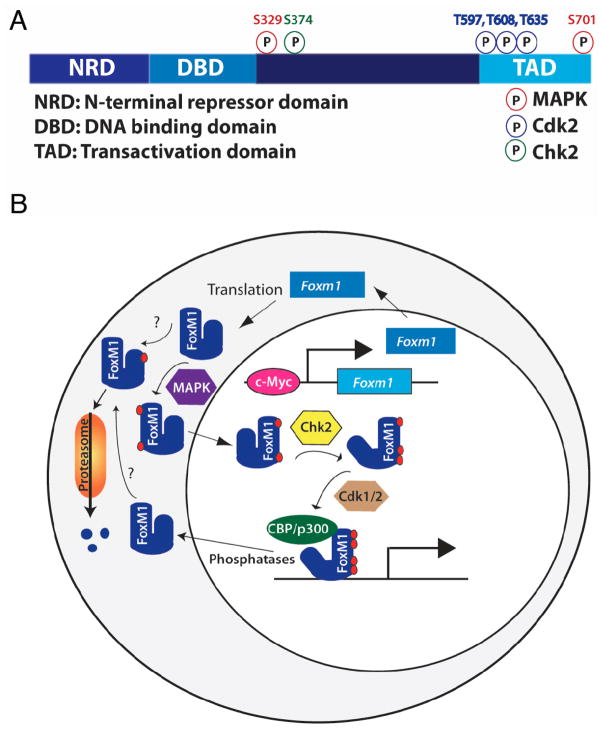
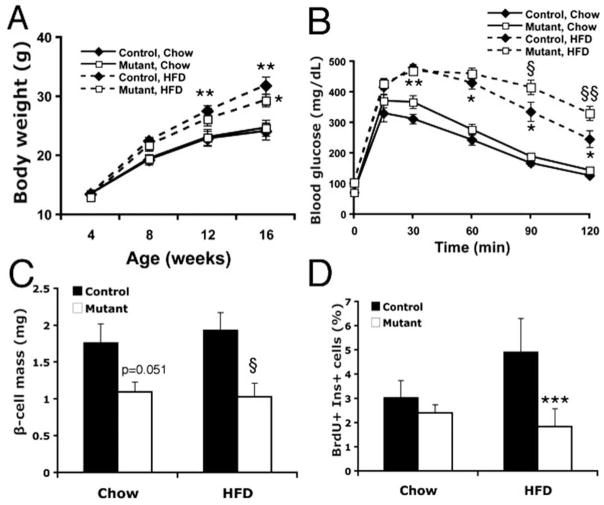
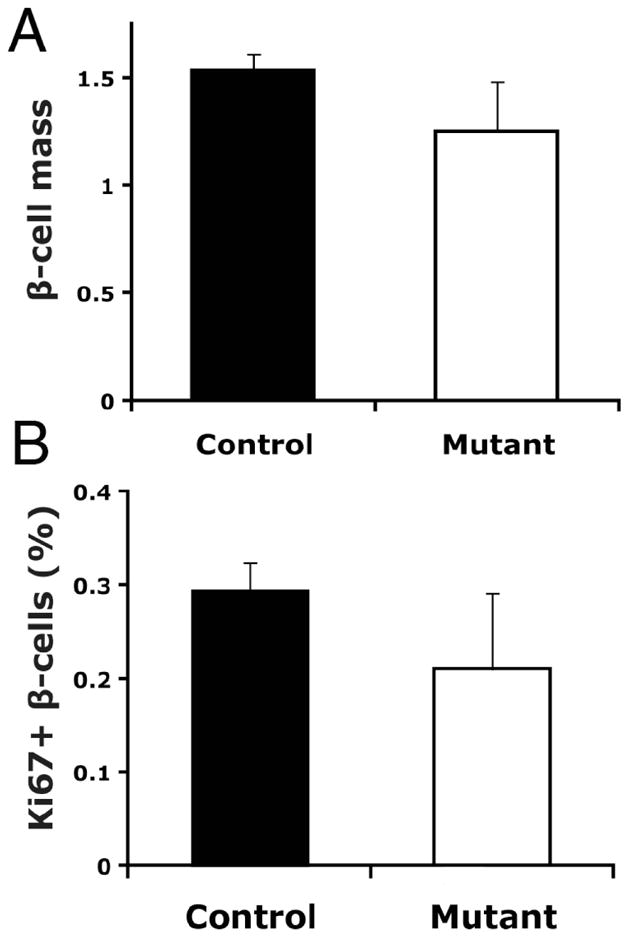
Type 2 Diabetes (T2D) is characterized by relative insulin insufficiency, caused when peripheral tissues such as liver, muscle, and adipocytes have a decreased response to insulin. One factor that elevates the risk for insulin resistance and T2D is obesity. In obese patients without T2D and initially in people who develop T2D, pancreatic β-cells are able to compensate for insulin resistance by increasing β-cell mass, effected by increased proliferation and hypertrophy, as well as increased insulin secretion per β-cell. In patients that go on to develop T2D, however, this initial period of compensation is followed by β-cell failure due to decreased proliferation and increased apoptosis. The forkhead box transcription factor FoxM1 is required for β-cell replication in mice after four weeks of age, during pregnancy, and after partial pancreatectomy. We investigated whether it is also required for β-cell proliferation due to diet-induced obesity.

Keywords: FoxM1; Obesity; diabetes; pancreas.


Figures

Fig. 1
Fig. 1
The effects of obesity-induced impaired insulin signaling. Red arrows indicate the ultimate effect of impaired insulin signaling in a given cell type, while red circles indicate initiating events that do not occur because of impaired insulin signaling. A) Impaired insulin signaling in adipocytes increases FFA release during the fed state, decreases energy storage, and decreases adiponectin release, the latter of which causes further decreases in peripheral tissue insulin sensitivity. B) In muscle (as in other cell types), impaired insulin signaling leads to decreased translocation of Glut4 to the plasma membrane, decreasing glucose uptake and increasing blood glucose levels. C) Elevated insulin signaling in hepatocytes leads to increased fat storage, which causes insulin resistance. Impaired insulin signaling in hepatocytes also leads to an increase in gluconeogenic gene expression, glucose release, and ultimately increased blood glucose levels. D) In β-cells, impaired insulin signaling results in decreased expression of proliferative and anti-apoptotic genes, contributing to reduced β-cell mass.
Fig. 2
Fig. 2
Model of FoxM1 regulation. A) FoxM1 contains an N-terminal repressor domain (NRD), a forkhead DNA binding domain, a transactivation domain (TAD), and a less-well characterized fourth region. Known mouse FoxM1 phosphorylation sites and their kinases are noted. B) Foxm1 expression and activity are tightly regulated. Foxm1 expression peaks in late G1, and is maintained through mitosis. FoxM1 activity is slightly delayed compared to its RNA expression, due to posttranslational regulation. FoxM1 cytoplasmic/nuclear shuttling is controlled by MAPK phosphorylation. Autorepression by the NRD is relieved by Chk2 phosphorylation, and the recruitment of coactivators is regulated by Cdk1/2 phosphorylation. Because Chk2 and Cdk1/2 are primarily nuclear proteins, phosphorylation of FoxM1 by these factors likely occurs in the nucleus, although this has not been confirmed. The order of phosphorylation events and whether multiple phosphorylation events are required for FoxM1 activity are currently unknown, and whether nuclear FoxM1 binds to DNA before phosphorylation by Chk2 and Cdk1/2 is unclear. N-terminal phosphorylation, dependent on the APC cofactor Cdh1, targets FoxM1 for proteosomal degradation. Phosphatases involved in FoxM1 dephosphorylation are currently unknown.
Fig. 3
Fig. 3
qRT-PCR on isolated islets suggests that Foxm1 and target genes Polo-like kinase and Aurora B kinase are upregulated in islets of male C57Bl/6J mice on HFD for 8 weeks (n=1–2).
Fig. 4
Fig. 4
Effects of HFD on C57/Bl6x129SvJxCBA Pdx1-Cre;Foxm1flox/flox female mice or controls. A) Both controls and mutants gain significantly more weight on HFD than on chow by sixteen weeks of age, but exhibit no differences compared to each other whether on chow diet or HFD (n=10–12). B) At eight weeks of age, both controls and mutants on HFD exhibited glucose intolerance compared to animals of the same genotype (n=10–12). Glucose intolerance in Foxm1 mutants was more severe than in controls. C) At sixteen weeks of age, Foxm1 mutants on chow diet exhibited β-cell mass approximately 60% of control mice on chow. At this timepoint, no increase in β-cell mass was observed in either controls or Foxm1 mutants on HFD compared to animals of the same genotype on chow (p=0.051; n=5–6). D) β-cell proliferation was significantly reduced in Foxm1 mutants compared to controls on HFD (n=5–6; *p<0.001, **p<0.01, ***p<0.005 Chow vs HFD; §p<0.05, §§p<0.01, Foxm1 mutant vs control).
Fig. 5
Fig. 5
Intraperitoneal glucose tolerance tests for C57Bl/6J Pdx1-Cre;Foxm1flox/flox or control female mice fed HFD. IPGTT at four (A), eight (B), or twelve (C) weeks of age. (D) At eight weeks of age, both controls and mutants on HFD exhibited glucose intolerance compared to animals of the same genotype on chow diet at eight weeks of age during the entire course of the IPGTT, as measured by area under the curve (AUC, p=0.004), but not at twelve weeks of age (p=0.10; n=3).
Fig. 6
Fig. 6
β-cell mass and proliferation in C57Bl/6J Foxm1 mutant and control female mice on HFD. A) β-cell mass was not significantly reduced in Foxm1 mutants at twelve weeks of age (p=0.11). B) The percentage of β-cells positive for the proliferation marker Ki67 was not significantly different between Foxm1 controls and mutants at twelve weeks of age (n=3).

References

    1. Everson SA, Goldberg DE, Helmrich SP, et al. Weight gain and the risk of developing insulin resistance syndrome. Diabetes Care. 1998;21(10):1637–43. - PubMed
    1. Williamson DF. Descriptive epidemiology of body weight and weight change in U.S. adults. Ann Intern Med. 1993;1:119, 646–9. - PubMed
    1. Lewis CE, Jacobs DR, Jr, McCreath H, et al. Weight gain continues in the 1990s: 10-year trends in weight and overweight from the CARDIA study. Coronary Artery Risk Development in Young Adults. Am J Epidemiol. 2000;151(12):1172–81. - PubMed
    1. Sun XJ, Rothenberg P, Kahn CR, et al. Structure of the insulin receptor substrate IRS-1 defines a unique signal transduction protein. Nature. 1991;352(6330):73–7. - PubMed
    1. White MF, Maron R, Kahn CR. Insulin rapidly stimulates tyrosine phosphorylation of a Mr-185,000 protein in intact cells. Nature. 1985;318(6042):183–6. - PubMed

LinkOut - more resources